Friday, June 3, 2011

Upgrading to Informatica PowerCenter 9.1 from Version 8.6

We have completed the upgrade from Informatica PowerCenter 8.6 to PowerCenter 9.1. The Informatica Upgrade Guide for PowerCenter 8.5.x and 8.6.x describes an in-place upgrade of an existing hardware and software environment. However, as we wanted to upgrade our hardware at the same time, our plan was to setup a brand new Informatica PowerCenter 9.1 environment and import the code from our legacy PowerCenter 8.6 server.

Installing Informatica PowerCenter 9.1 on a Windows 64-bit server was straight forward but we ran into the following two issues:
  1. There seems to be a bug in the Pre-Installation System Check Tool (i9Pi). The purpose of this tool is to check that the server meets all installation requirements. This tool kept raising the following error “Make sure that open cursors are at least set to 1000” for our repository connection information to our Oracle 11g database. Even after our DBA had set this value to 1500 and restarted the Oracle 11g database service, the Pre-Installation System Check Tool continued to raise this error. This seems to be a bug in i9Pi because the installation was able to complete successfully.
  2. If you are planning on running Informatica PowerCenter 9.1 on a Windows platform, please be aware that Informatica has released an Advisory for Windows 32-bit Server and 64-bit Server Platforms. Informatica has identified problematic behavior of the PowerCenter Server, which a user would observe when monitoring multiple concurrent tasks from PowerCenter Workflow Monitor. This behavior is tracked as CR 252994 within Informatica’s bug tracking system. Informatica has released an emergency fix that can be downloaded at the following location:
After installing Informatica PowerCenter 9.1 and starting the service, one has to log into the Administration console (http://server-name:6008) and create the Repository Service and the Integration Service. Once done, install the Informatica PowerCenter 9.1 Client on a client workstation and re-create all Connection information in Workflow Manager. This is a critical task because dependent objects cannot be validated during import without having all corresponding source and target connections defined.

Export all Informatica content from the legacy 8.6 environment into an XML file and import it into the Informatica PowerCenter 9.1 environment with Workflow Manager (Repository ==> Import Objects). After this, we were able to run the imported code in version 9.1 without problems.
Please let us know about your experiences with upgrading to PowerCenter 9.1.

Friday, May 27, 2011

How-To: Creating a Universe with the BO XI 4.0 Information Design Tool

The following describes the steps to create a universe with SAP BusinessObjects XI 4.0's new Information Design Tool.


We would like to start with a graphic displaying a systematic method to create universes in the new tool.


Figure 1: Universe Creation Flowchart for the Information Design Tool

There are a few new terms that may jump out as you are reading this, but in case you have not noticed them, let's take a minute to list those terms out:

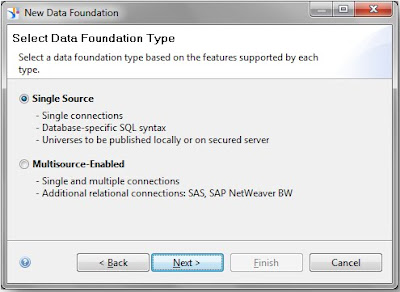
  • Connection – define how a universe connects to a relational or OLAP database. Local connections are stored as .CNX files, and secure connections are stored as .CNS files.
  • Data Foundation – a schema that defines the relevant tables and joins from one or more relational databases. The designer enhances the data foundation with contexts, prompts, calculated columns, and other SQL definitions. The data foundation becomes the basis of one or more business layers.
  • Business Layer – the universe under construction, and when the business layer is complete, it is compiled with the connections or connection shortcuts and data foundation, published, and deployed as a universe.
  • Universe – the compiled file that includes all resources used in the definition of the metadata objects built in the design of the business layer.

Each of the items above refers to a resource that can be stored in a Project when developing in the Information Design Tool. A project is a named local workspace that contains one or more resources used to build universes. Projects can be shared so that multiple designers are able to work on the same resources.

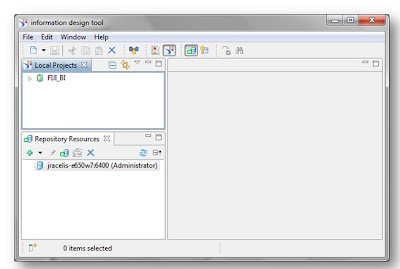
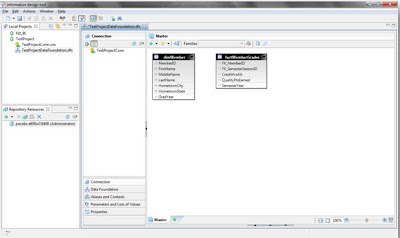
Step 1: Open the Information Design Tool. The new interface screen will be displayed.

NOTE – All created resources will be labeled as "TestProject[resourceType]", i.e. "TestProjectConn" for Test Project Connection.


Figure 2: New Interface Screen

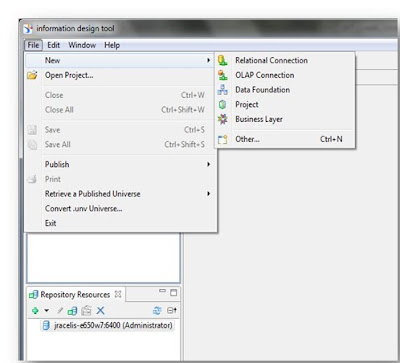
Step 2: Create a new Project by clicking on File->New->Project.


Figure 3: Create Project Option

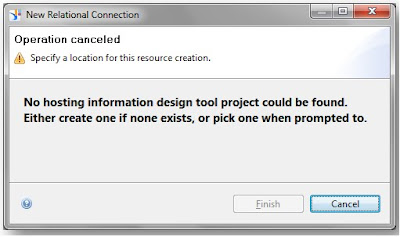
A local project must exist to assign resources; otherwise an error message will be given.


Figure 4: Sample Error if no local project exists


Figure 5: New Local Project Created

Step 3: Create a new Connection. Right-click on the project you just created, or use "File->New" and choose the Relational Connection or OLAP Connection.

For the purpose of this entry, we will be creating a Relational Connection.


Figure 6: Choose a Connection


Figure 7: Define a name for Connection

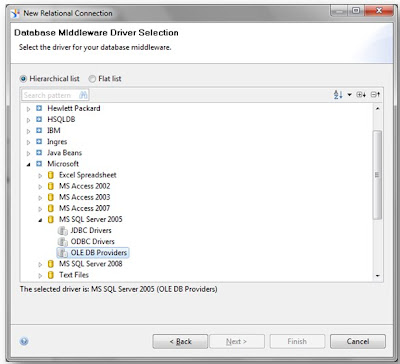
Step 4: Select the proper Database Middleware driver and configure the connection. The tool comes equipped with several DB driver connections with a default installation.

Note – You must have proper privilege to the schema you are accessing. Also, an ODBC or OLE DB connection must already be established to function properly.


Figure 8: Choose the Middleware Driver


Figure 9: Connection Configuration 1


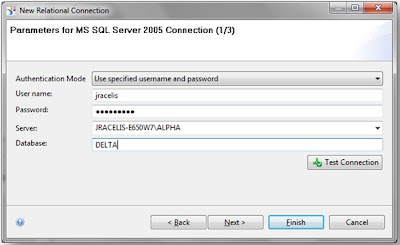
Figure 10: Connection Configuration 2


Figure 11: Connection Configuration 3


Figure 12: New Local Connection Created

A new connection should now be present and expanded in the project. This connection remains local to the project. Connections to be used in published universes will need to be published to the repository and saved as secure connections.

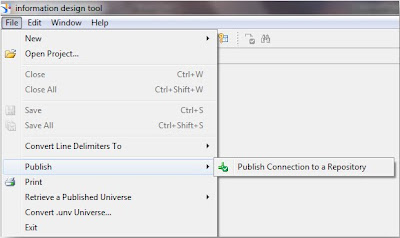
Step 5: Publish the connection to the repository as a secure connection. Right-click on the new local connection, or highlight the connection and choose the "File->Publish->Publish Connection to a Repository" option.


Figure 13: Publish the Connection to a Repository


Figure 14: Secure Connection Shortcut Established

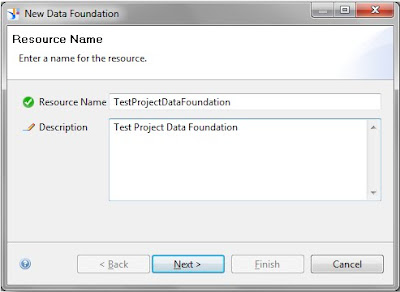
Step 6: Create a new Data Foundation and configure the Data Foundation. Right-click on the project you created, or use the "File->New->Data Foundation" option.


Figure 15: Data Foundation Configuration 1

Note – there are two types of data foundations: Single-Source and Multisource-Enabled.

Single-Source

  • Support a single connection.
  • The connection can be local or secured, which means you can publish universes based on the data foundation either locally or to a repository.
  • Recommended for the following situations: you want to work exclusively with database-specific SQL syntax, or you want to publish the universe locally and work outside of a repository.
Multisource-Enabled

  • Support one or more connections.
  • You can add connections when you create the data foundation and anytime later.
  • Multisource-enabled data foundations only support secured connections, and universes based on this type of data foundation can only be published to a repository.
  • Required for the following situations: you want to insert tables and joins from more than one relational data source, you want to insert tables and joins from more than one relational data source, or you want to use SQL-92 syntax and SAP BusinessObjects SQL functions.


Figure 16: Data Foundation Configuration 2

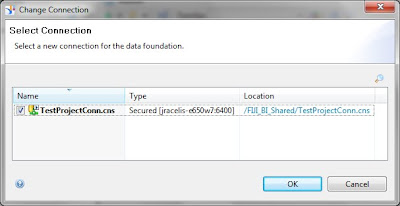
Step 7: Select the Connection to associate to the Data Foundation.


Figure 17: Data Foundation Configuration 3


Figure 18: Data Foundation Created

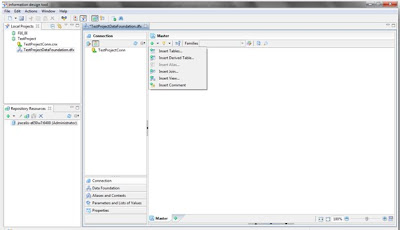
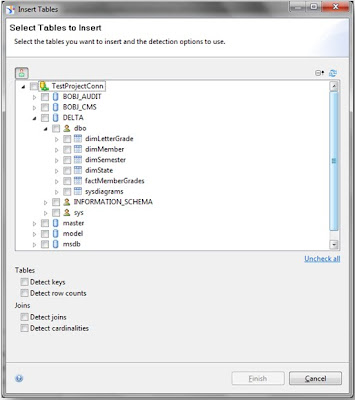
Step 8: Choose the Tables to Insert. You also have an option to insert Derived Tables and Views as well.

Note – Joins to objects in the Data Foundation can either be detected or manually inserted.


Figure 19: Insert Tables for Data Foundation 1


Figure 20: Insert Tables for Data Foundation 2


Figure 21: Data Foundation Created

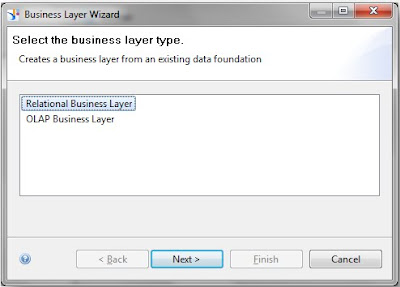
Step 9: Create a Business Layer. Right-click on the project you created, or use the "File->New" and choose the Relational Business Layer or OLAP Business Layer. The type of business layer depends upon the connection that you used for the Data Foundation.


Figure 22: Business Layer Configuration 1

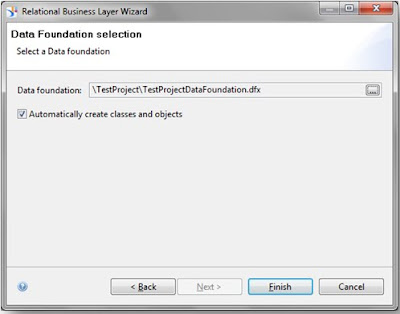
Step 10: Select the Data Foundation that you would like to use as the basis for the business layer. The tool also provides the option to automatically create classes and objects based on the Data Foundation Layer.


Figure 23: Business Layer Configuration 2


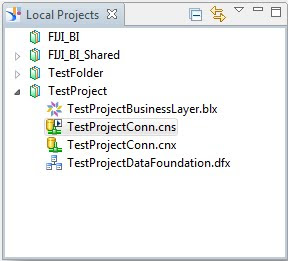
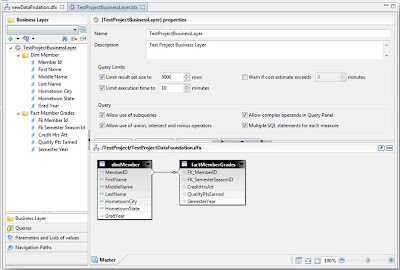
Figure 24: Business Layer Created


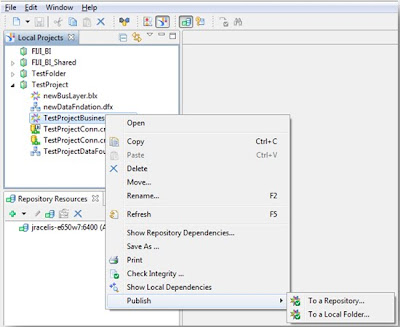
Step 11: Publish the Universe to the Repository. Right-click the Business Layer and choose the "Publish->To a Repository" option. This will save the Universe as a .UNX file.

Note – Ensure the Connection for the corresponding Data Foundation is a Secure Connection.


Figure 25: Publish Universe 1


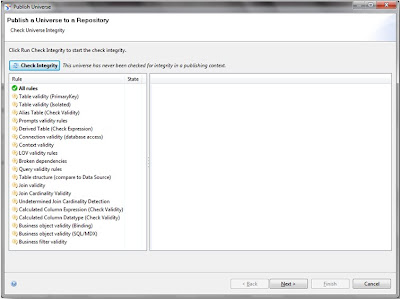
Step 12: Execute a Universe Integrity Check and ensure critical errors are resolved.


Figure 26: Publish Universe 2


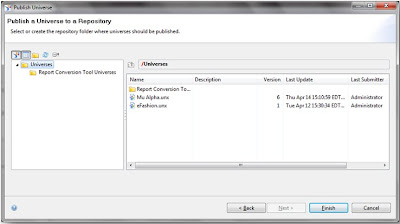
Step 13: Choose the Repository Folder to store the Universe.


Figure 27: Publish Universe 3


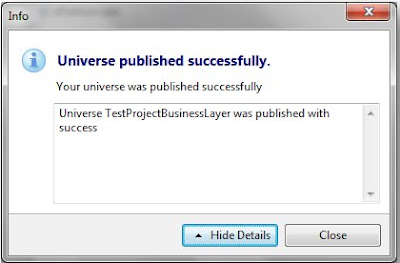
After clicking the "Finish" button, the Universe is successfully published and ready for use by the users.


Figure 28: Universe Published


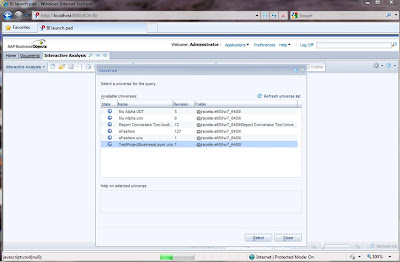
You can verify that the Universe is available by logging into Interactive Analysis and creating a new document.


Figure 29: Universe Available for use in Interactive Analysis


This concludes the guide to create a Universe using the Information Design Tool. As you can see, some new terminology has been added along with a different approach to create an entire universe. We feel that the new layout and approach is tailored for multiple information designers to work on specific resources. Even though no official statement has been made by SAP BusinessObjects, we believe that the Information Design Tool will become the eventual successor to the Universe Design Tool.

Monday, May 23, 2011

Overview of Business Objects XI 4.0

SAP recently released its Business Objects Enterprise 4.0 Business Intelligence (BI) platform. The new version made updates to enhance both the end user experience and the administration of the application.

End Users
The new home page for Business Objects 4.0 is the BI Launch
pad. Formerly called InfoView, BI Launchpad welcomes users to Business Objects with a home page similar to iGoogle. Widgets displayed on the home page include My Applications, My Recently Viewed Documents, Unread Messages in My Inbox, My Recently Run Documents, and Unread Alerts. A ‘Widget’ is a user interface allowing quick access to data or an application. The BI Launchpad also features tabbed browsing.

When logging in, users have two default tabs, a home tab (previously mentioned) and a documents tab. The Documents tab gives users the old InfoView Folders view featuring Favorites and Inbox. Another advantage of tabbed browsing is the ability to have multiple reports open at once, a feature Business Objects users have wanted for awhile now. Users have the option to pin reports/documents, making them available for quick access each time the user logs into the system. Below is a screenshot of the BI Launchpad.

Another user tool modified for the Business Objects 4.0 release was WebIntelligence. WebIntelligence is also called Interactive Analysis for this release. The best feature added to the WebIntelligence tool is a raw data view available in the query panel. Users simply click a Refresh button when building their query and 15 rows of raw data are presented allowing for a quick analysis of the returned data set sample. See the screenshot below for an example of the Data Preview feature.
This allows the user to modify the query if the expected results are not shown before running a larger report. Other highlights include more chart types with additional chart features, toolbars in ribbon form similar to Office 2007, and greater consistency between the Java and Web Interfaces.
Other user tools updated with the Business Objects 4.0 release include Desktop Intelligence, Xcelsius, Life Office, Voyager, and Explorer. Desktop Intelligence is eliminated from the Business Objects Enterprise package. All Desktop Intelligence reports must be converted to either Crystal Reports or Web Intelligence reports. The report conversion tool can be used before or after the Business Objects 4.0 upgrade is performed. Xcelsius is still available but has been renamed to Dashboard Design. Live Office is incorporated within the release, allowing BI content to be more accessible throughout the Microsoft Office suite. Voyager, Business Objects’ OLAP data analysis tool, has been replaced with Advanced Analysis. Advanced Analysis highlights an enhanced task and layout panel view to improve productivity and depth of analysis for multidimensional data. SAP Business Objects Explorer is a data discovery application that allows users to retrieve answers to business questions from corporate data quickly and directly. Explorer is installed as an add-on to Business Objects Enterprise 4.0, and can be integrated with the BI Launchpad.

Administrators
Administration updates have been made throughout the Business Objects 4.0 Enterprise.
The look and feel of the Central Management Console (CMC) is similar to that of BOXI 3.0, although several features have been updated for greater user administration. Auditing has been updated throughout the release. The CMC Auditing feature allows administrators to modify what is being audited. Monitoring is now available through the CMC. Monitoring allows administrators to verify all components of the system are functioning properly. Response times can be viewed and CMS performance can be evaluated within the Monitoring feature. See the screenshot below for the Monitoring interface.
Universe design received an update in the 4.0 release with a new tool called the Information Design tool. The highlights of the tool include the ability to create multisource universes, dimensional universes that support OLAP dimensions and hierarchies, and easier management of repository resources. Each universe will now consist of three files (or layers), a connection layer, a data foundation, and a business layer. The connection layer defines the connections used for universe development. The data foundation layer defines the schemas being used for a relational universe. The business layer is the universe created based on your data foundation. Resources can be shared, allowing connections and data foundations to help create multiple business layers (or universes). Below is a screenshot showing the Information Design Tool. The upper left shows the project with the different layers created. The bottom left shows the shared repository resources. The right side is similar to previous versions of Business Objects Designer.
Import Wizard has been replaced by two separate tools, the Upgrade Management tool and the Lifecycle Management Console. The Upgrade Management tool allows for direct upgrades from Business Objects XI R2 SP2 or later. The new easy to use interface allows upgrades to go more smoothly. The Lifecycle Management Console is a web-based tool which gives administrators a way to handle version management. Rollback and promotion of objects is available among different platforms if the same version of Business Objects is being used.

Getting to 4.0
Business Objects 4.0 is a complete new install, an upgrade option is not available. To migrate over specific application resources (Universes, CMS data, etc.), older versions of Business Objects (5.x, 6.x) must be upgraded to Business Objects XI R2 or later first. The deployment of 4.0 has also been simplified through the use of a single WAR file for web application deployment. Business Objects servers and web application tier can only be installed and run on 64-bit operating systems.

Friday, April 29, 2011

Parallelization of ETL Workflows

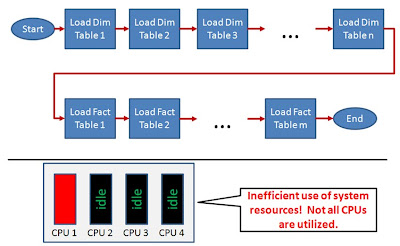
One of the most often overlooked ETL architecture design techniques is to ensure that all available hardware resources, in particular CPUs, are utilized. Consider the sample ETL workflow in the figure below. In this workflow, all ETL tasks are scheduled to be executed in series, i.e. one after another. In general, execution tasks only utilize one CPU (with some exceptions). Thus, executing one task after another would only utilize a single CPU, no matter how many CPUs are available.
Thus, in order to utilize all available CPUs on a server, ETL tasks should be scheduled to execute in parallel. Scheduling a highly parallelized ETL workflow requires some planning as all ETL task dependencies need to be understood first. For example, if DimTable1 and DimTable2 are dimension tables for FactTable1, then DimTable1 and DimTable2 need to be loaded first before FactTable1 can be loaded. In addition, if there are no dependencies between DimTable1 and DimTable2, then we can execute their specific ETL processes in parallel.
The output of this dependency analysis is an ETL Task Execution Order Map, as outlined in the figure below. The ETL Task Execution Order Map will then be the template for the ETL workflow layout. As each task will utilize an available CPU, this approach will be able to utilize multiple (if not all) CPUs and provide better performance.
One word of caution, though: The number of parallel scheduled tasks should not significantly exceed the number of CPUs on your server. If there are many more concurrent tasks than CPUs, then the overhead of the OS scheduler switching jobs in and out of CPU time may actually decrease performance.
To avoid this problem, many ETL tools (such as Informatica Power Center) provide a global setting that limits the number of concurrently processed tasks regardless of how many tasks are scheduled to run in parallel. Let us call this setting N. As a general rule, N should be set to the number of CPU (cores) of the server. In this case, one should schedule as many tasks in parallel as outlined in the ETL Task Execution Order Map. This option is very useful in environments with different number of CPUs in the development, test, and production hardware as we do not have to create workflows based on the underlying hardware constraints. In this case, we just set N in each environment to the respective number of CPUs.

Friday, April 8, 2011

Efficiently Integrate Google Web Toolkit (GWT) Widgets Across Multiple Platforms

Introduction

Google Web Toolkit (GWT) is an open source development toolkit for building web applications. GWT allows developers to write sophisticated AJAX applications in Java and then compile the source in optimized JavaScript that runs across all browsers. While Java delivers the benefits of “write once, run anywhere”, GWT creates the possibility of “write once, integrate anywhere”.

GWT can be used to develop fully functional UI widgets that interact with back-end services. Most often a GWT widget needs to be integrated into an application. If the application is also developed in Java, the integration is a simple matter of importing the widget's source code or JAR in class path. But what if the application is built with a non-Java platform, such as .NET? It is important to keep in mind that GWT compiles Java code into JavaScript and JavaScript can run in any browser. Therefore GWT widgets, as compiled in JavaScript, can be integrated into any browser-based web application.


StockWatcher [1] is likely to be the first example for most GWT developers. It is used here to demonstrate how GWT widgets can be integrated into web applications regardless of platform.


Local Mode

It is assumed that the steps in [1] are followed to create StockWatcher with client-side only Java code. Since there is no server-side code, the "WEB-INF" folder can be skipped or safely removed after GWT compiler compiles. The remaining component only consists of a set of static files, including JavaScript, CSS and other HTML resources. A copy of these files can be included as local resources in any web application to integrate StockWatcher. This is defined as "local" integration mode.


For example, Application ABC just needs to include three lines in one of its HTML files to integrate StockWatcher. In fact, the host page can be any typical web file such as JSP, ASP or ColdFusion, as long as its source is rendered as HTML in the end.


The integration is self-contained and non-intrusive. When opened in any browser, StockWatcher becomes a fully functional section within the host page. Apart from the three lines above to integrate the StockWatcher widget, the rest of the host page can include any content. The example here only has the text "My Application". No matter what it is, GWT widgets will co-exist with the rest of th
e page side by side.


When the application is running, server output shows that StockWatcher communicates with the quote server to receive updates. The callback parameter indicates that the communication is in JavaScript Object Notation, with padding (JSONP) format. See the following server log.


Remote Mode
In "Local" integration mode, applications obtain a copy of StockWatcher and refer to it as local resources. Unfortunately, this means that each application must update its local copy for every new release of StockWatcher. Just imagine if Google Maps were integrated in this way. An alternative is to host StockWatcher on a server and let all applications refer to it from this single remote entry point. This technique is defined as "Remote" integration mode. This mode centralizes and simplifies management of the widget.


The updated host page in My Application will refer to StockWatcher deployed on locahost at port 8080. Note that it uses the same three lines but different “href” and “src” values as compared to those of “Local” mode.


However, StockWatcher does not show up correctly (as expected) when opening the host page in the browser. A blank section is displayed instead. Close inspection finds the following lines in Firefox Error Console.


It turns out that cross-site behavior must be enabled for the communication to pass through. This is done by adding xs-linker in StockWatcher.gwt.xml.


Once StockWatcher is recompiled and redeployed, the host page opens up successfully in the browser and StockWatcher behaves the same as in "Local" mode. The quote server also shows the same output.


Summary
As shown, GWT widgets can be integrated in either "local" or "remote" mode into any web application. This can be achieved by developing client-side only Java code and using JSONP to overcome the Same Origin Policy (SOP) security constraint. In the case of "remote" mode, xs-linker needs to be added to enable cross-site behavior. Altogether, this proves to be an efficient way to reuse existing investments and opens the possibility to create some really interesting applications.


References

[1] StockWatcher, http://code.google.com/webtoolkit/doc/latest/tutorial/Xsite.html


[3] SOP, JSONP and XS Linker, http://code.google.com/webtoolkit/doc/latest/FAQ_Server.html

Tuesday, March 29, 2011

The Art of Identifying Meaningful BI Requirements

We have seen time and time again that the success of DW/BI implementations is dependent on the ability to identify BI requirements that have a measurable impact on the organization’s business decision making process (see our blog article “You just need three letters: WHY?”). However, identifying such requirements is a not a trivial process. A repeatable process is needed that is designed to keep the focus on the client’s business when developing business requirements for a DW/BI implementation. The following sections describe an overall approach with suggested techniques that we have used successfully.

Macro Level Understanding of Business

It is important to understand how your organization operates: how the business runs in order to make the best use of your BI capability. When you understand the key business processes and key business objectives, you can begin to drill down into more details that will provide not only reporting requirements, but also the data elements that are required to support those requirements.

Business Processes/Objectives

By understanding the business at a high level, you can begin to understand the business processes that support the organization. We need to understand what the key business processes are, then we need to understand how they work. We also strive to understand the core business objectives. Ultimately, all decisions that the customers make should support one or more business objectives. Once we identify business decisions, we can more easily identify detailed business questions and related data elements. The business questions will lead directly to specific reports or sets of reports. The data elements will support those reports and potential ad hoc analysis needs.

How to Implement

We can use the following tools and techniques to implement this requirements process. Background Research provides initial information about the nature of the business and its processes. It can help provide a preliminary list of decision centers, activities, and major decisions that are part of the organization you are focused on.

Structured Interviews should be used to build on the initial research you have gained. Seek out those who are knowledgeable of the organizational business processes. Through the interview process, the interviewer can gain information about problems, decisions, or critical success factors that are part of the running of the business. This high-level information can be used as a starting point in gathering more detailed requirements necessary for building a decision support system. Ask questions that lead the interviewee to indirectly identify information that supports decision-making. One approach is to ask the interviewee to identify the major business drivers that they are responsible for. Once these drivers are identified, ask them to identify the major decisions that they need to make to support those business drivers and one or more questions that they ask in the process of making each decision. Another approach is to ask your customer to identify the critical success factors they are responsible for. The individual should then be asked to identify for each critical success factor the information they need to ensure that the critical success factor is under control.

Joint Application Design (JAD) is a communal effort to further refine and agree on the hierarchy of business needs. When individuals are interviewed alone, they tend to respond to questions more or less in a vacuum; without the context of others’ views on how information is used. They also may have difficulty identifying a comprehensive set of answers to each question they are asked. A JAD session helps to elicit greater “thinking” by the participants as they hear other ideas and perspectives. A JAD session helps to bring out more decisions and business questions as more approaches are identified. The result: a more complete set of requirements upon which to build a BI system. The JAD session will be most successful if the right people are present. Individuals who have a solid understanding of each of the business processes to be covered, have the authority to make design decisions, and communicate well, should participate. The facilitator should be knowledgeable in BI system design as well as the business being supported. A JAD session should be held only after you have identified a baseline of business drivers, business decisions, and business questions based on information from the initial set of structured interviews and research.

Prototyping is a technique used after initial requirements have been established. Based on the information gathered from interviews and JAD sessions, you can develop an initial reporting database with limited BI reports. This gives you an opportunity to demonstrate the information and functionality of the reports to end users early in the development process. The feedback you received will help you to fine-tune your product early in the process so that the delivered product more closely meets your customer’s needs.

The figure below summarizes how a top-down approach will help to derive both reporting requirements as well as supporting data elements. For each business objective, there may be several business processes and decisions to support that objective. Each process and decision will involve business questions that need to be answered to support the process or decision. A business question may drive a specific report requirement. Meanwhile, each business question will require multiple data elements. By going through this process, you not only identify business-driven requirements for your BI system; you also keep the customer more heavily involved by forcing them to think critically about how their day-to-day decisions help drive the overall business. We have found these techniques to be successful using them in different combinations based on our client situation. How have these techniques worked for you? What other methods have you found valuable in driving requirements for your reporting initiatives?

Friday, March 4, 2011

Conditional Report Execution in OBIEE

Here is a solution for providing conditional report execution based on prompt selection. For example, if a user chooses value ‘A’ in the prompt, then report ‘Report A’ should be executed. If a user chooses value ‘B’, then OBIEE should execute report ‘Report B’. In other words, the prompt will not be used as a filter but rather as a tool to conditionally execute reports. Here are the steps to implement conditional report execution: In this example, we want to conditionally execute the following two OBIEE reports: “Detail” and “Summary”. The prompt should determine which of these two reports should be executed. First, we have to create a prompt with two hard-coded values: "Detail" and "Summary". 'Detail' and "Summary" refer to the respective reports that we want to execute. We can select any column that is not being used in the report.

SELECT case when 1=0 then "Dim Credential"."Credential Type Level 1" else 'Detail' end FROM "Field Readiness" union all SELECT case when 1=0 then "Dim Credential"."Credential Type Level 1" else 'Summary' end FROM "Field Readiness"
The prompt will now look like this: Next we will have to create a new report "pqr" that we will use for guided navigation. This report must include a column that returns the constant value "Detail". We then create a filter on the column with a constant value "Detail" using presentation variable "xyz". This report will only return values when the prompt value is same as "Detail". Since we know the prompt has two values "Detail" and "Summary", this report will not return any record when the prompt value is set to "Summary". Next we have to go into the dashboard editor and create three sections, one for the prompt and one for each of the two conditional reports. We then click "Properties" on the Report 1 section and select "Guided Navigation" option. We now have to refer to the "pqr" source report as shown in the image below. Then click ‘Properties’ on Report 2 section and select ‘Guided Navigation’ option. When we open the new dashboard page, we can now test whether the conditional report execution is working. Please let us know if you have any questions.