Monday, January 31, 2011

Bing Map Integration with OBIEE 11g

As in OBIEE 10g, OBIEE 11g provides the ability to integrate Bing maps in the presentation layer through HTML and Java Script in the Narrative view. This blog demonstrate this functionality. In the example below, we will plot cities on a Bing map with conditional icons based on profit amounts (blue and red). This demo uses custom data but can be further extended to use real data sets.
Here are the steps to integrate Bing maps:

1. Create a new report that includes city, state, latitude, longitude, and the profit amount measure.
2. Format the columns Latitude and Longitude to have at least 6 decimal places to ensure precise plotting on the map.

3. Now in the Results tab, add the Narrative view to include the custom Java Script shown below. In the Prefix section call the Bing map API and declare the required variables. In our case we used arrays to hold the latitude, longitude and profit.
var v_lat = [];
var v_long = [];
var v_profit = [];
4. In the Narrative section, pass the required columns with @{column_location} with Latitude and Longitude. In our example we have passed Latitude (@4), Longitude (@5) and Profit (@3).

v_lat.push(@4);
v_long.push(@5);
v_profit.push("@3"); // The added "$" makes profit a string value.
5. Define the following two functions in the Postfix section:
GetMap(): Sets the default settings for the map (like 2D mode), initial location (init_x1), default view to Road, and map zoom size to 4.

AddShapes01(): Loops through the array length and drops the push pin icons (custom icons) for each latitude and longitude, and their respective title.
6. Check the “Contains HTML Markup” in the Narrative.

The image below shows the table view and the Narrative View in the dashboard.

Feel free to contact us with questions.

Thursday, January 13, 2011

OBIEE Data-Level Security with a Twist

Row-level data security can be enforced in the RPD by filtering column values based on role membership of the user. With this approach, users can only retrieve records (i.e. rows) to which they have access to. In other words, users only have access to a subset of records.

We have encountered the following data-level security requirement that needs a different approach: Our client’s organization was divided into several geographic regions. Members of one region had to be able to see all summary-level data for ALL regions but were only allowed to see detail-level data of their own region.

The organization was divided into 10 regions and the OBIEE implementation was to measure sales revenue generated by sales persons associated to these regions. All users, regardless to which region they belonged, had to be able to see the sales revenue numbers for all regions. However, they were not allowed to see the names of the sales persons from other regions. In this scenario, the standard row-level security approach did not work since it would have prevented the users from having access to the summary level data for all regions. After all, all records would have been filtered by their own region by design. Therefore, records from other regions would have been invisible.

The solution required the following alternate approach: Instead of filtering data rows we had to implement conditional data masking based on role membership.

We have implemented the solution as follows:

1) We configured OBIEE to use the client’s enterprise LDAP as its authentication source.

2) We then created the following new LDAP groups and assigned users to their appropriate group:

□ ORCL_BI_EMBI_Region_1_Restricted_Data
□ ORCL_BI_EMBI_Region_2_Restricted_Data
□ ORCL_BI_EMBI_Region_3_Restricted_Data
□ …
□ ORCL_BI_EMBI_Region_10_Restricted_Data
□ ORCL_BI_EMBI_HQ_Restricted_Data (people in this group should be able to see all detail data)

3) We created a GROUP session variable in the INIT BLOCK of the RPD to hold all LDAP group names to which the current users belongs.

4) All sales person attributes were stored in the DIM_RESPONSIBLE_PERSON dimension table. In order to simplify the data-level security logic in the RPD, we have added an additional column “LDAP_GROUP_NAME” to this dimension table. The ETL process populates the LDAP_GROUP_NAME based on the region membership of the sales person.


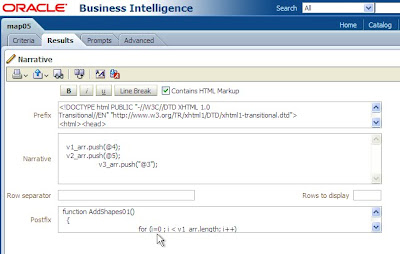
5) We then created new logical columns in the DIM_RESPONSIBLE_PERSON table in the RPD’s business layer to include the conditional data masking logic. For example, the code for the new logical FirstName column looked like this. We have added the ORCL_BI_EMBI_HQ_Restricted_Data group to allow HQ users to see all data:

CASE
WHEN LOCATE('ORCL_BI_EMBI_HQ_Restricted_Data', VALUEOF(NQ_SESSION."GROUP")) > 0
THEN EMBI."DimResponsible Person"."First Name1"
WHEN LOCATE(EMBI."Dim Responsible Person".LDAP_GROUP_NAME, VALUEOF(NQ_SESSION."GROUP")) > 0
THEN EMBI."Dim Responsible Person"."First Name1"
ELSE '*****'CAST (EMBI."Dim Check In Out Person"."Person Ky" AS CHARACTER ( 30 ))
END

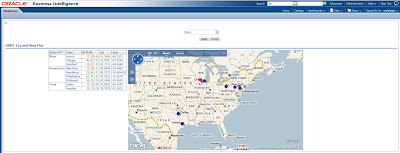
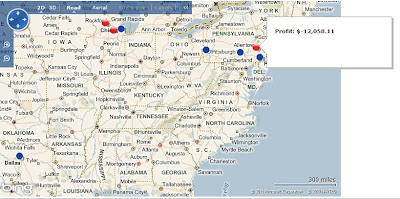
6) When logging into OBIEE as a Region 6 user, one will see all summary data for all regions und detail-level data for region 6 only as seen in the screenshot below.

Tuesday, January 11, 2011

How to Protect High Value Project Resources

Improving a PMO with Project Portfolio Management 
The IT PMO of a large organization was suffering from failing projects. The issues facing the organization were:

  • Continuous mergers and acquisitions resulted in stove-piped, independent businesses with no incentive to work toward common goals, 
  • Division between Business and IT, 
  • Resistance to change, 
  • No application/ systems standards (multiple solutions for the same capability), 
  • No view of resource capacity/ demand, 
  • No single view of all projects, 
  • Failing projects. 


The Problem
Important projects were not getting done. With no prioritization and no view of true resource demand/ capacity, low-value projects were gobbling up resources needed by high-value projects. This caused the more valuable projects to be stalled or stopped in mid-implementation. This also resulted in corners being cut when project managers tried to shotgun projects through the lifecycle to ensure they did not lose precious resources. Project planning was one key phase that was shortened or skipped altogether, leading to a higher rate of project failure.

Projects under a certain budget limit could be submitted and were automatically put in the project queue to be resourced within a week. Anyone could submit a project request and provide very minimal supporting information.

What Didn’t Work
The organization had tried different methods for prioritizing (such as having the head of finance label projects as high-, medium-, or low-priority). However, these methods yielded only top-priority rankings for virtually all projects.

For higher cost projects, IT Governance did exist. In the fall of each year, the IT site directors would provide business case information for projects they wanted to implement in the coming year. The regional leader would review and accept the projects he or she deemed priority for the site; and an oversight committee eliminated additional projects from the plan to lower the total site budget to match what they could allocate. The results of these meetings determined each site’s budget. In the following year, the sites were free to substitute other projects for those that had been approved, making this an exercise in obtaining funding, not in proper portfolio planning.

The Fix
The PMO leaders determined that the two main issues to be resolved were lack of resource management and prioritization. They concluded that implementing project portfolio management could resolve both issues and result in successful planning and project management.

The goals for the Portfolio Management implementation were as follows:

  • Tie projects to the corporate strategy,
  • Develop business cases for all proposed projects, 
  • View projects across all sites to determine opportunities to combine efforts,
  • Improve project planning, 
  • Develop solutions standards: 
    • Catalog accepted applications for specific capabilities. 

They developed a model for scoring project requests which would serve as the basis for prioritization. The model was based on research of best practices in the industry and tied to the organization’s strategy. Once the model was in place, it was used to prioritize the projects submitted for the yearly budget to demonstrate to the decision makers why they should fund the proposed projects. They now had clear insight into what should be done (prioritization) ) and what could be done (resource management). Including portfolio management in the project lifecycle greatly improved the organization’s ability to successfully implement projects. It is well known that Portfolio Management is intended to maximize the benefit from an organization’s portfolio of projects; but it also helps ensure project success by “sizing” the portfolio to fit the available resources.

With Guident’s scoring model development and our portfolio management best practices, we can help you improve your Project Management success rate. Your portfolio of projects will also be better aligned to achieve your strategy and provide maximum return.