Thursday, December 2, 2010

Modeling Multiple Helper Tables in OBIEE

Problem: Dimensional modeling is the preferred method of organizing data in OBIEE but at times the standard configuration for a dimensional star does not represent the way data is collected in the source system.

Traditionally, a star schema has a single fact table with many dimensions. The dimensions are related to many fact records in a one-to-many relationship to the fact. However, sometimes the relationship of the data is many-to-many. An example for this comes from the healthcare industry where one doctor visit record can be associated with multiple diagnosis codes.


We encountered such relationships at a recent project. One of the source systems at this client captured incident data. A traditional star schema did not meet our client’s requirements because this source system collected key measures at an incident grain but there was a need to analyze these measures at a grain below the level at which they were created. The incident data was organized into a six level hierarchy, each of which with a one-to-many relationship to the level below. All the important KPI’s were captured at the incident level. As can be seen in the hierarchy diagram below, an incident is the summary level (top level) of data collected.
We had to create reports at a detail level called “cause of incident” for damages or injuries captured in aggregate at the incident level. The challenge was to attribute all damages in an incident to each cause without double counting damages or injures at the grain being reported.

First, we created Incident, Shipper, Product, Container, and Cause dimensions. Next we created an incident fact table that held all appropriate measures. We then created bridge-tables for each dimension with a many-to-many relationship.
Unfortunately, bridge-tables require a weighting factor. Since the measures existed in the source system only at the summary level, the weighting factor would not correctly attribute fatalities to each detail level item. For example, an incident with 2 fatalities occurred. The incident was attributed to have been caused by an accident and fire. When counting the number of deaths because of fire the business rule is to count 2 for fire not 1 as a weighting factor of .5 would do.

So we decided to trick OBIEE. The picture below shows the central fact with many helper tables that are 1:M from the fact.


However, by leaving the join as a 1:M OBIEE treats the helpers as separate facts. The performance is awful and it does not aggregate correctly. So we changed the relationship to 1:1 and it worked. Because it is an inner join the SQL sent to the database returns the correct number of rows and OBIEE still think the fact is a fact.
The downside is that grand totaling does not work correctly, which did not cause a problem for our requirements, though. If your client’s business rule is to attribute summary level measures equally across the details then a bridge table will work with the appropriate weights. If you need to have multiple many-to-many details using un-weighted summary level measures this solution will work. In summary, this method may not work for every project but for some business requirements it will make a challenging scenario work.

Please contact us if you have any questions.

Friday, November 12, 2010

Identifying Source System Data Changes for Incremental ETL Processes

Problem: When designing incremental ETL processes, ETL Architects face the challenge of identifying algorithms to identify data changes in the source system between ETL runs. Some of the options that might be available are (from the best case scenario to the worst):

  1. Database Log Readers: This approach utilizes an ETL tool that is capable of reading the source database log files to identify inserted and updated records. For example, Informatica Power Center supports this through its Change Data Capture (CDC) functionality. However, source system owners may not be willing to grant read access to the database logs or an ETL tool that supports this functionality may not be available.
  2. Timestamp columns in the source database: If the source system maintains an insert and update timestamp column for each table of interest, then the ETL process can utilize these columns to identify source system changes since the last ETL execution timestamp. Chances are, however, that the source system does not provide that functionality.
  3. Triggers to populate log tables: This is by far the worst option since it adds a significant resource utilization burden to the source system. In this case, triggers are created for all tables of interest. The purpose of these triggers is to capture all insert/updates/deletes into log tables. The ETL process then reads the data changes from the log tables and removes all records that it has successfully processed. Again, source system owners will most likely be very hesitant to support this approach.
What to do if none of these options are available?


Solution: We propose the following checksum based approach. In this blog, we will utilize SQL Server’s CHECK_SUM algorithm; however, Oracle’s ORA_HASH can be used in a similar fashion.

This approach requires that the entire source table (only columns and rows of interest, of course) be loaded into a staging table. During the staging load, the ETL process will assign a checksum value to each record. For example, when loading data from SOURCE_TABLE_A into STAGING_TABLE_A, the SQL would look something like this:
insert into staging_table_a ( col1, col2, cold3, business_key, check_sum)
select col1, col2, cold3, business_key, check_sum(col1,col2,cold3,business_key)
from source_table_a

Let us further assume that business_key is the primary key of the source system record. In other words, business_key uniquely identifies a record in the source system.

Both business_key and check_sum must be stored in their corresponding dimension tables. In our example, the dimension table for source_table_a would include a surrogate dimension key (dim_key), business_key, and check_sum as shown below.
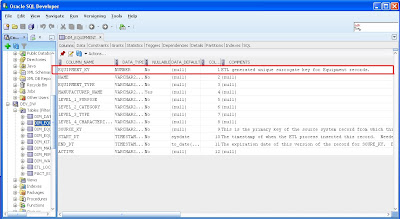
For performance optimization reasons, we recommend to create a composite index on business_key and check_sum.

In order to identify new records that were inserted into the source system since the last ETL run, we have to find all business_keys in the staging table that have no corresponding business_key in the dimension table. The SQL code would look something like this:


select s.* from staging_table_a s
Where not exists (select * from dimension_table_a d
where d.business_key = s.business_key)


To identify updated records since the last ETL run, we have to find all records in the staging table that have a matching business_key in the dimension table with a different check_sum value. Here is the SQL code for this:

select s.*
from staging_table_a s
inner join dimension_table_a d on
d.business_key = s.business_key and
d.check_sum <> s.check_sum
In all cases, the joins against the dimension table will be based on index lookups because we have a composite index on business_key and check_sum. Therefore, identifying new or updated records is quite efficient. The drawback of this solution is the necessity to perform a full data load into the staging area, which may not be feasible for large source systems.

One of the major benefits of this approach is its immunity against getting out-of-sync with the source system (due to aborted or failed ETL processes). No matter at what point the previous ETL process has failed, this approach will always correctly identify source system changes and re-sync without any additional human intervention.

In summary, the check_sum approach may be a feasible alternative for environments that have no other means for identifying data changes in the source system.

Please contact us if you have any questions.

Monday, October 25, 2010

Pushing OBIEE Reports or Dashboards to an FTP Server

Pushing reports with Oracle BI Publisher to an FTP server is built into its bursting capability. However, pushing OBIEE Answers reports to an FTP server requires a few customizations. One approach for accomplishing this functionality in OBIEE Answers is to create two iBots: The first iBot will save the report file to local disk and the second iBot will push the file to the FTP server.

Here are the step-by-step instructions for how to accomplish this task.

1) Create the following Java script file in the {OracleBI}\server\Scripts\Common folder. For this demonstration's sake, let’s call this file Testing.js.

Content for Testing.js:
var fileName
var filesysobj = new ActiveXObject(['Scripting.FileSystemObject']);
fileName = ['D:\\public\\data\\OBI\\Reports\\'] + Parameter(1) + ['.PDF'];
var fooFile = filesysobj.CopyFile(Parameter(0), fileName, true);
This script expects the filename as in input parameter (Parameter(1)). In this example, the script adds the extension ’.PDF’ and writes the file to D:\public\data\OBI\Reports\. This can be customized to meet your needs.

2) Now we have to create an iBot that executes the Testing.js script. In order to do that, go to Delivers and create a new iBot. Select an existing Answers report or a dashboard page and specify the delivery format such as HTML, PDF or CSV.


Now, click on the Advanced tab. In the Filename textbox, enter the name of the script to execute (Testing.js) and select Java Script as the file type. Under Results, choose “Pass delivery content to script”. Under Other Parameters, enter the filename of the report output file. This value will be passed into the Parameter (1) in the Testing.js script.


3) The iBot in step 2 wrote the report file to local disk. Before we can create the iBot that pushes the file from local disk to an FTP server we first have to create several files in the {OracleBI}\server\Scripts\Common folder:


The first file (ftp_mht.js) is a Java Script that executes a Windows batch file ftp_mht.cmd.


ftp_mht.js:

var wshShell = new ActiveXObject("WScript.Shell");
var sdsdsds =
"D:\\Public\\server\\apps\\OracleBI\\server\\Scripts\\Common\\ftp_mht.cmd";
wshShell.Run(sdsdsds, 0, true);

The Windows batch file ftp_mht.cmd executes the FTP batch command. In our example, the control file ftp_mht.txt provides the input parameters for the FTP command as outlined below.
ftp_mht.cmd:

ftp -n -i -s:C:\OracleBI\server\Scripts\Common\ftp_mht.txt

ftp_mht.txt:
open {Hostname}
user {username} {password}
cd {target_directory_on_FTP_server}
binary
mput C:\TEMP\*.PDF
bye
4) Now we can create an iBot to execute the ftp_mht.js script. Since the script does not expect any input parameters, we will have to select the “Pass no results to script” option in the Advanced tab.


5) When scheduling the FTP delivery of this particular OBIEE report or dashboard, these two iBots will have to be chained.

Please drop us a comment if you have any questions!

Friday, October 22, 2010

Why are there so many definitions of Project Portfolio Management?

Several years ago when Project Portfolio Management was starting to get more attention and recognition, I worked for a Project Management software company. Those of us in the industry recognized the need to offer a Portfolio Management solution. So we claimed we had that because we gave organizations a view of their projects across the organization. This was a great capability but missed the major value of Portfolio Management. Portfolio Management (PfM) should bring maximum ROI from the organization's investments. Project Portfolio Management is focused on aligning projects to corporate strategic to achieve the business goals. So Project Portfolio Management does look across all the projects of an organization (so does the PMO) but the definition doesn't stop there, the key is the value that the PPM process brings to the business.

Wednesday, October 20, 2010

Toward Ensuring Project Success

Is there any way to guarantee project success? Absolutely not, however, examining lessons learned from past projects can reveal valuable information to help ensure project success. Here we will look at processes, procedures and people to determine how to optimize project performances. Best practice project management procedures require that planning takes time and attention. Most seasoned project managers can recall a project that failed due to rushed (or no) planning. The project manager and project team are also important to project success. What makes a good project manager or project team? Corporate culture plays a strong role in aiding or hindering quality project management. It is important to keep in mind what has and hasn’t worked in the past as you plan and implement the project.

I once lead a project which was viewed as easy by the management and as very risky by the project team. Management continuously told us this was a piece of cake (of course they wanted to believe this!). As a good project team, we conducted risk analysis and believed this to be very risky. Amazing that those of us who were going to be working on the project knew from the start that it would be one of the hardest things we ever did. All the scary facts were there: lean staffing and a late start, the team had absolutely no experience in some aspects of the project and the requirements on our statement of work did not match the signed customer contract. In addition, morale was low because we were short of resources and upper level management reminded often that our performance was poor. We weren’t meeting project budgets or timelines


The project issues got worse as time went on. A key team member quit when the project had just one month left to go and some of the team members did NOT get along. Management continued to ignore the project issues, still seeing the project as an easy win.
Some very interesting things happened on this project which resulted in its eventual success. To improve team attitude, we attended an inspiring seminar that helped us build an improved team attitude. The seminar reminded the team that you own the results of what you do. The attitude changed from “we are doomed” to “we will make this successful.” The fact that we were seen as performing poorly was both good and bad for us. This brought morale down but motivated us to “show leadership that we could succeed”. In an effort toward motivating the team, I did something I don’t think I would recommend to others but it worked for the project. I arrived at work very early and left when the last team member left. This made for very long hours and included weekends and holidays. I learned to test and run the equipment we were building. The team appreciated my hands-on approach and this helped grow a good team relationship.
All the team’s efforts were worth it in the end as the project succeeded. We had happy stakeholders – the customer, our management and our suppliers (as part of our team). We had the satisfaction of knowing we had done well despite all obstacles.

Lessons Learned
What caused this project’s success? First we had a strong commitment to project goals. The Project goals were simple: 1. Customer satisfaction (providing the equipment they needed on time and working to spec) and 2. Turn around our poor performance record. Customer satisfaction is always a goal but this was also our first external (outside our own organization) customer, promising a good deal of future business if we succeeded. Satisfying management would change the corporate culture as they recognized our competence and learned how to improve the culture to support project management. The team was very committed to the goals. Second, the team learned the power of teamwork and the power of strong commitment to doing things right to achieve project objectives. People understood that they could get beyond their issues with other team members by concentrating on the target – to make the project succeed. We had a good amount of discussion on the effect of dependent tasks on each other. Prior to this project, the team members focused on their own tasks without paying attention to the entire project plan. Third, we included the key stakeholders on the team. We worked with the customer both in showing the project progress as time went on as well as helping the customer in tasks they needed to complete for the project. We negotiated a mutually beneficial relationship with our vendors and included them on the project team. The vendors promised their quickest turnaround when we encountered sudden specialized needs (such as quick build of custom parts). We promised a good amount of future business to the vendors. This stakeholder participation lowered risk, lowered scope creep, and ensure that what we produced was what the customer needed.

What could we have done better? We didn’t have the resources available to start the project when we first received the contract so we had to start 2 months later. This required some rushing of the planning phase. In addition, we needed a more supportive corporate culture and improved team effort and attitude.

What are other ways to ensure project success? First we take a look at the elements of project management that are very important to project success. Next, we take a look at the people and the organization. What qualities do the Project Manager, Project Team and the organization need to promote eh best project management?
Working toward Successful Projects

At Project start: Defining Success Criteria, Considering Stakeholders and Project Planning
The first phase of a project’s lifecycle is very critical to its success. It is always important to complete a project in the timeliest manner but skimping on planning can lead to project failure. Once the project has been proven to be valuable to the organization, careful planning is needed. The stakeholders should be identified and analyzed. The key stakeholders define the project’s success criteria. Rather than rushing the planning to get on with the project and complete faster, in planning, you will find areas to trim time in implementation.

How many times have you heard people say “we never have time to plan but we always have time to do it over”? For a project to succeed, the planning must be well thought out, thorough, documented and agreed upon. It is human nature to want to rush in and get started on a project, rather than spending considerable time planning. Yet it is well known that careful planning and project estimation is key to success of the project. Good planning can actually reduce the time required for the implementation phase. Important elements of project planning are stakeholder analysis, definition of success factors, team input and risk management planning.

Stakeholder analysis requires time and thought as there are the obvious stakeholders and the not so obvious stakeholders. There are stakeholders that determine if the project has succeeded and those that do not want the project to succeed. Among the stakeholders are people competing for your resources or with agendas that oppose your project. The Project Manager needs to formulate strategy for dealing with all stakeholders, ensuring key stakeholders participate as team members and negotiating with stakeholders that are competing for the same resources.
While the project manager and project team must bring the project in on time and in budget, this does not define success. In the end, the customer declares the project successful or failed. For this reason, the first step in Project Management is in understanding the project’s objectives. The Project Manager and team must work very closely with the customer and all stakeholders to ensure clear understanding of the critical success factors as well as understanding stakeholder issues . From the success factors, metrics should be defined to ensure the success factors can be demonstrated at the conclusion of the project.

As part of the stakeholder analysis, identify the Executive sponsor and determine the level of support provided by this project champion. If the project does not have good executive sponsorship, it is not likely to succeed. I once directed a project for a client to solve a problem identified in an audit. In a mid-project review, the client informed me that they did not agree with the audit finding and, therefore, did not see the value of the project. They allowed the project to complete through the pilot phase but not to production.

Sometimes the stakeholders have unrealistic expectations. Customers almost always want it yesterday, cheap and perfect! The project’s schedule, budget or scope, as defined by the client, may not be reasonable. When we were designing custom equipment for our own company the schedule was set by the customer with no regard to how long it should take, the budget was set by the customer based on what the customer could pay and, of course, the technical specification was set by the customer. Therefore, the budget, schedule, specification and stakeholder expectations were unrealistic. An example of both unrealistic expectations and improper customer strategy involved a project I was handed on my first day with a company. The project team was to design a machine that would automate work that was currently done manually. When it was transferred to me, the project was several months into its timeline with no design or concept developed. Yet, the customer was informed that the project was still on track. I recovered the situation by explaining the issue (while begging forgiveness) and bringing the customer onto the design team. As the customer had design concepts of his own, this plan worked out.

Throughout the Project: Managing Risk and Change
Scope creep is a big issue in project management. The project plan works for the scope of the project agreed to in the planning stage. As the project progresses, stakeholders, customers and even project team members can see opportunities to make the solution even better than originally planned. While this improvement sounds good, it will lead to cost overrun and schedule slippage. The Change Management process must be well established and must be adhered to by all involved with the project. Each change needs to be clearly documented, providing the impact to budget, schedule, resources, and risk and project results. The decision to include the change belongs to the project’s customer. On one project I managed, we decided that we should go forward with most of the customer out-of-scope changes simply to ensure customer satisfaction. This backfired on us. When the project was late and over budget, the customer saw this as project failure despite all the “free” changes we provided.

While the risk taker may not see the value to risk management planning, this is very important in project management. The risk management plan is not a document to be filed away once the planning is complete. The risks must be analyzed, documented and reviewed on a regular, ongoing basis. As the project progresses, risk mitigation activities will need to be completed as the issues occur and new risks will be discovered and included in the plan. Think of risk management planning as always having a plan A, plan B, and plan C.

What makes a good Project Manager?
As leader of the project team, the Project Manager takes care of obstacles that get in the way of the project team. This attitude motivates the team and ensures the project is run efficiently. As a good leader, the project manager will build the trust and confidence of the project team members, listening to team member views and seeking their expert advice. As leader, the project manager should acknowledge and recognize team members for their contribution. The type of project manager that a project team does not like is the project manager who is hands-off on the project, expects the team to do all the work and take all the responsibility and risk. This type of project manager is usually known for finger pointing (all errors are made by a team member) and stealing credit when things go right.

The Project Manager must help promote efficiency. I came into an organization consisting mostly of engineers and quickly discovered that they did not appreciated project management. I soon discovered that this attitude resulted from their current project manage processes. The project management meetings took up a great deal of the team’s time. Furthermore, they did not see value in attending the meetings. The project manager conducted the meetings to update project status reports, not to hear from the team about current issues. Thanks to the previous project managers, I learned a valuable lesson: one way to show respect is to not waste that person’s time and never forget the value of listening. A meeting needs a purpose, an agenda and a chance for each team member to discuss what he or she feels is important to the purpose of the meeting. Attendees need to walk away from the meeting knowing that they gained something from attending.

Enthusiasm spreads; therefore, if the Project Manager is enthusiastic, the team is more likely to be enthusiastic. The attitude of ownership of the project and its results works much the same way. If the project manager believes that the team owns the results of the project, the chances of success are much higher. The Project Manager can influence the team to understand the importance of owning the results.

A very difficult task of a project manager is staying on top of project details while, at the same time, being able to see the big picture. The project manager must be aware of how the project relates to the business and how it fits in with other projects. On the other hand, the project manager must be close enough to the details to deal with issues as they occur.

Even with a carefully planned project, things change constantly as the project progresses and the project manager must make appropriate, quick decisions. A project manager cannot pass all decision making up the chain of management or push all decisions down to the team. There will be many decisions that need to be made to keep the project on course. In some cases, the project team can take time to analyze the situation and determine the best action and this is the best course if schedule will not be affected. Good Project Managers can judge which is appropriate – a quick decision or more thorough analysis of the issue.

The project manager must negotiate with the client, the stakeholders, vendors, the project team members and the organization’s management. Good skill in negotiating can result in customer and stakeholder satisfaction, optimized pricing from suppliers and optimized efficiency from the team members.

What makes a good project team?
A good project team recognizes its ownership of the results of its efforts. Projects don’t just happen; they are planned and implemented – by the project team, the “owners” of the project. Characteristics of good project teams include: cooperation, collaboration, communication, strong interest in the project and strong interest in achieving the project goals. Just like a sports team, the project team must be more strongly concerned with the results from the team’s effort than with individual achievements. We see the struggle to achieve this team attitude in sports and it is not easier for a project team member in a society where individual career success is typically dependent on individual achievement. The project manager and the corporate culture can promote the importance of team effort by balancing rewards for team effort as well as individual efforts.

One element of cooperation involves clearly understanding the affect of each team member’s tasks on the other tasks as well as the overall schedule. One PMO I worked in had very aggressive project schedules. Rather than raising flags that the schedules were unreasonable, the project teams would develop schedules that they could not meet. Trying to keep to the overall schedule always meant that the last tasks were done on an extremely short and unrealistic timeline, putting a great deal of stress on the team members who had to wait until the end to complete his/ her tasks. After completing a project where this occurred, the team had a lessons learned session and this issue was brought up. After much discussion, the team members who had the earlier tasks agreed to determine ways to bring in their task schedules to avoid this problem on the next project.

Open team communication is important. It is very detrimental to a project if team members are adverse to bringing up issues, concerns or anything that may be seen as a mistake. Finger pointing does not make for good teamwork. Team members should bring up issues and problems and should not feel they have to hide mistakes.

The Project Management Organization
The organization keeps the project management system optimized through: 1. A proactive, customer- driven culture that puts emphasis on planning and monitoring, 2. High level support of project management, 3. Fostering innovation through allowing mistakes and encouraging open communication, and 4. Well defined and understood processes.

Project management processes and procedures need to be adaptable. The process should never be the same for a large complex project and for a small, quick straight forward project. Yet some organizations do not have flexibilities in their project management system.

Increasingly, businesses are seeing the value of project management as it brings efficiency and order to an organization. As globalization increases, strategy and planning are more important to keeping a business competitive. Because good Project Management helps an organization achieves its goals, the leadership needs to foster and support an environment that promotes Project Management disciplines. To support good project management, the business needs to promote innovation. This requires taking chances, which can lead to mistakes but can also lead to great discoveries. Communication, cooperation and collaboration are important both up and down the chain of command.

Toward Project Success
Best practices in Project Management require looking to the past, present and future:
· Look to the past –remembering what has worked and what hasn’t worked.
· In the Present - the project manager and project team must pay careful attention to all that is happening on the project t each day.
· Look to the future - through careful planning, adjusting as required and carrying out risk mitigation activities.

There are no easy answers to ensuring project success as there are many elements of the business as well as the project itself which can contribute to a project’s success or failure. It is important for the project manager and project team to have the characteristics and disciplines that lead to winning projects, however, the team needs proper organizational and cultural support for project success. On the other hand, if the processes and procedures aren’t optimized, using best practices, the project is more likely to fail.

Optimizing the Portfolio of Investments with Scoring Models

The Business Need for Prioritizing Investments
How can your business maximize return on its investment? How can you balance resource capacity and demand? How can you ensure you are achieving your strategic goals? Can you provide clear justification for your portfolio of investments? These major business concerns drive the need for organizations to develop Portfolio Management to ensure the business is making the best investments.

The Solution: A Scoring Model for your Investments
Portfolio Management is a structured and disciplined process for selecting the portfolio of investments that best meet the strategic goals of the organization, delivering true competitive benefit to the business. This process requires evaluating each requested investment against specific criteria, the scoring model, which reflect the business’ definition of value. The investments are prioritized based on these evaluations and analyzed against budget and resource constraints and other factors.
Formulating the scoring model that reflects the organization’s view of value is the key to ensuring optimized prioritization of investments. For this reason, the task of developing the scoring model should not be taken lightly. Leadership can work with scoring model subject matter experts to determine the requirements for the model.

Scoring Model Benefits
· Provides objective and quantifiable criteria for evaluating and selecting investments
· Provides quantifiable information for optimized investment decisions
· Funding decisions no longer based on intuition, politics or the concept that all ideas are acceptable
· Ties investments to strategic objectives to help ensure strategic goals are achieved
· Balances short and long term gain
· Maintains benefit to risk ratio that best fits the business
· Takes into account the health of projects and programs to lower the loss from failing projects
· Maximizes return on investment


Developing a Scoring Model
Developing a scoring model for investment prioritization ensures the portfolio of investments provides maximum value to the business. Because each organization is unique, every scoring model should be different; however, there are common elements to be addressed across organizations. Guident has developed a basic scoring framework that can be adapted and modified as needed. The model looks at six areas for scoring: Strategic Alignment, Value/ Benefit, Compliance, Capability, Health/ Performance and Risk. Establishing the scoring model that works for an organization begins with defining value for the business based on review and analysis of these six areas.

Scoring model development process:
1. Define specific business drivers in each of the six areas based on the definition of value for the business.
2. Prioritize the business drivers and weight them.
3. Determine survey questions and answers to make up the model based on these drivers.
4. Assign numeric values to each possible answer.
5. Sum the weight multiplied by the value for each answer to provide the total score.
The organization evaluates the new and existing investment candidates using the defined scoring model, basing prioritization and funding decisions on the final scores.

The Six Elements
The Strategic Alignment element addresses how the investment aligns to the overall strategy of the organization. Strategic Alignment is measured against the strategic objectives defined by the leadership of the organization. This establishes a clear view of how the investments contribute to achieving corporate strategy thus identifying the portfolio of investments to enable the organization to meet its objectives. This also provides a view of the level of investment for each objective.

The Compliance element addresses how an investment aligns to the corporate governance requirements. This includes compliance with internal and external mandated regulations, initiatives, and architecture. Initiatives tied to federal and corporate mandates receive highest priority.

The Capability dimension addresses how the investment supports the mission of the organization. The mission provides the course of action that the organization needs to take in order to meet its operational requirements. The mission breaks down further into capabilities or competencies focused on the required systems, products and processes to meet customer needs and provide competitive advantage. Capabilities should be documented and prioritized so that the capability dimension returns the highest scores for investments aligned to the most important capabilities. Gap analysis can determine which capabilities already exist and which are still needed. An investment’s Capability score rewards investments that provide new capabilities required by the organization. If an investment offers a redundant capability, its capability score will be lower unless it is determined to be the most effective in providing the capability.

The Risk element addresses the likelihood of a risk event and the impact if that risk event were to occur. Defined risk categories can significantly improve the identification of risk events. The Risk dimension seeks to establish measurable data that focuses on factors that can adversely affect an investment’s ability to deliver its intended result.

The Value/ Benefit element addresses either the qualitative or quantitative value of the investment. Quantitative Values are financial calculations such as Return on Investment (ROI), or Cost Benefit Analysis (CBA) etc. Qualitative Value relates to intangible benefits that are meaningful to the organization. These values might classify projects as maintenance, transformation or regulatory. Further examples include efficiency improvement, cost savings, cost avoidance etc.

The Performance/Health element can be qualitative or quantitative as well. Health information is typically pulled from project management or operations data to indicate whether the investment is on schedule and on budget. Performance/ Health can be measured using standard earned value calculations for cost and schedule indicators in a strict quantitative approach or simpler variances from plan to highlight trouble areas. Performance analysis also needs to include benefits realization metrics and measures against requirements.

To read the full article, click on the following link:
http://www.guident.com/index.php?page=download&target=Investment_Scoring_Model.pdf

From Concept to Benefit: Achieving Corporate Strategy

The Business Need
Sound strategic planning is fundamental to achieving business objectives. Execution of the strategy is difficult and the complexities created by out of sync and competing activities, processes, functional groups and systems across the organization create many obstacles on the road to success. Constant change, corporate politics, functional silos and many other factors affect progress toward business objectives.

A sound business plan and clearly defined goals are essential, but the key to successful execution is understanding how to accomplish those goals. This paper looks at process relationships and
information flow across the business from strategic planning to achievement of the strategy, from great ideas to benefits realization. To ensure the business efficiently and effectively achieves its strategy, the organization must optimize the outcomes from their processes across the entire lifecycle.


While organizations put emphasis on improvement of individual processes, improvement across
processes and systems is often neglected. This big picture transformation is more difficult to tackle.

Over time, standalone systems, functional stovepipes and constant change cause issues around
data, communication, processes, systems and performance. While this task of analyzing and
improving the full lifecycle is difficult, the results are very valuable to the organization.

The Business Issues
Virtually every organization has information fragmented in multiple repositories and enterprise
applications. Many obstacles keep organizations from meeting their basic needs for efficient operations, strategic alignment and profitability. Common business issues include:
Process Issues:
o Inefficient
o Duplication of effort and disconnected
processes
o No standardization, documentation or understanding of process
o Poor metrics and poor performance
Data Issues:
o Insufficient or bad data
o Difficulty in obtaining data
o No authoritative source of data, duplicate entry
Technical Issues:
o Insufficient applications and infrastructure to support best practice processes
o Disparate applications and systems

Strategic Planning, Portfolio Management, Project Management
and Operations processes contribute to achievement of strategy, thus are critical to
business success.

Weaknesses in Strategic Planning, Portfolio Management, Project Management or Operations will result in problems in the other areas as there are information feeds and dependencies between these functions. In addition, the processes in each of these major areas must be efficient and must provide quality information to the other areas.

The strategic goals are meaningless to the organization unless they are clear, understood by all and interpreted into the activities required to achieve the goals. This means that executives should not throw high‐level strategic goals out to the organization with the directive to make it happen. Instead, they should have a clear idea of the major activities designed to meet the strategic objectives to ensure the organization is headed in the right direction. Leaders in Strategic Planning and Portfolio Management can work together to clearly connect the strategy with the required tactical activity.

Portfolio Management will determine the optimized Portfolio of investments based on
analysis, valuation and prioritization of the business needs. To prioritize investments, a
scoring model is developed based on the organization’s definition of value. The model will provide
strategic alignment and will represent the benefit provided by the investment.

Portfolio reviews and analysis require up‐to‐date information from Strategic Planning, Finance, Enterprise Architecture, IT Governance and Project Management. Finance provides available budget information to be used in determining how many items in the portfolio can be funded. Enterprise Architecture provides capabilities and Enterprise Architect requirements used in Portfolio Management selection process while Portfolio Management provides portfolio performance to capabilities and requirements to Enterprise Architecture. In some organizations, IT Governance will utilize the investment scores to prioritize and grant funding to investments.

When funding decisions are complete, approved projects move to the Project Management process in the lifecycle. Project Management is complex and key to achievement of the business needs. Therefore, best practice processes are key to achievement of the corporate plans.

Performance Management
Performance Management is an element in each of the processes as metrics and analysis are required to ensure each area is achieving its goals and to ensure benefits realization from the system as a whole. For decision makers, Portfolio Management will provide benefits realization metrics including financial benefits. Portfolio Management measures progress toward corporate goals based on the metrics for each goal and reports this information to Strategic Planning/Executives. For each Project, metrics will be established to ensure the project team is meeting the project goals. Project Performance is measured and analyzed to develop corrective actions and ensure risks are managed. This Performance information is reviewed in Project and Program reviews to ensure Project Management performance is optimized. Performance information is fed from the Project Management system to the Portfolio Management system (and/ or the Program Management system) to allow decision making for the portfolio and programs. In Portfolio reviews, project performance is taken into consideration and failing projects may be stopped.

Where Has This Solution Been Applied and What Were the Results?
A division of a government agency required an analysis of all applications, systems, processes and data across lifecycle management. The analysis showed they had legacy systems that were no longer supported, high maintenance homemade tools (requiring frequent coding), applications that only had a handful of users, standalone applications for each process, data entered manually in more than one application and manual processes. The analysis led to corrective actions to
eliminate or retire systems, automate and streamline processes and data feeds and implement a
more robust infrastructure. An IT/ Process Roadmap was developed to provide the needed solution concept and plan. A large company had merged many other companies into the organization. There were many scattered databases, duplication of effort, re‐packaging of information for different levels of the organization, different databases, processes, and reports across the same functions. Excessive time was spent manually generating reports in preparation for management decision‐making meetings. There were no standard project performance metrics across the enterprise. Portfolio management had been developed using a very complex process involving numerous Excel spreadsheets. A new lifecycle was designed to standardize and automate Project Management, Portfolio Management, IT Governance and Financial Management across the merged businesses. This solution brought all the data for these processes into a centralized database, providing greatly improved efficiency, improved data accuracy, cost and labor savings and elimination of non‐value added work.

Building the Holistic Lifecycle Solution
How do you build the holistic lifecycle process to optimize sharing information across processes,
eliminate duplication of tasks, and improve each process while optimizing across all processes?
To see the full article, click on the link. http://www.guident.com/index.php?page=download&target=Achieving_Corporate_Strategy.pdfpage=download&target=Achieving_Corporate_Strategy.pdf

Achieving Corporate Strategy

Scoring Models: Optimizing the Portfolio

Scoring Model: Optimizing the Porttfolio

Friday, October 8, 2010

Best Practices for Maintaining a Data Dictionary

Maintaining an up-to-date Data Dictionary is an important but often neglected task of data modelers. The most critical success factor for maintaining an up-to-date Data Dictionary is the ability to associate data elements to their corresponding business description within the data modeling tool itself. We will demonstrate how this can easily be accomplished with Computer Associate’s ERwin Data Modeler.

Step 1: Open your data model in CA ERwin Data Modeler and switch from the Logical view to Physical or Dimensional view. Enter the business description for each column into the corresponding “Comment” column property as shown below.

Step 2: If your target database server supports comments, ERwin can generate comments in the schema DDL script. In order to demonstrate this functionality, we will use ERwin’s Forward Engineer functionality to push our data model to an Oracle 11g database server. Make sure to check the “Comments” check-box under “Other Options” in the Forward Engineer Schema Generation wizard.

Step 3: The comments are now available in the database. The screenshot below shows that the comments are visible in Oracle’s SQL Developer. Thus, the data dictionary and all its business descriptions are now fully integrated into the meta data of the database objects.

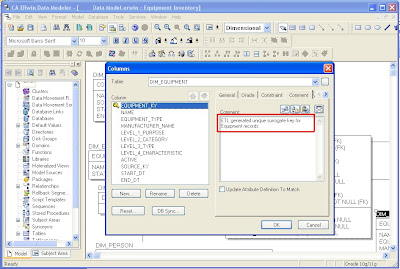
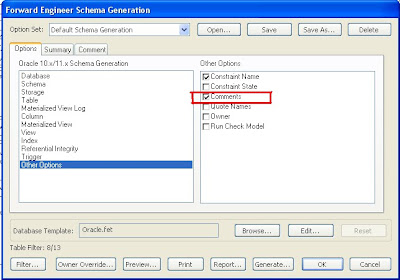
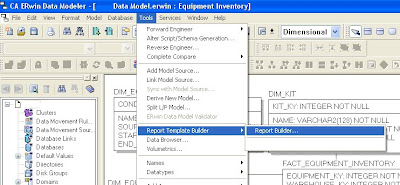
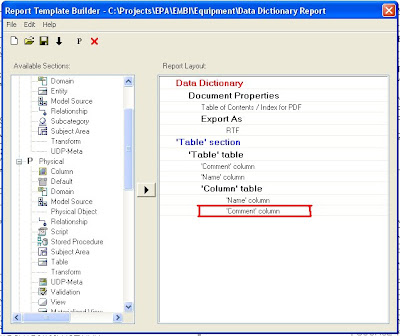
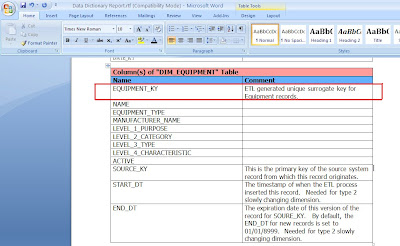
Step 4: Use ERwin’s Report Builder to create a Data Dictionary document. Report Builder queries the ERwin data model to create high quality PDF, Word, XML, or HTML documents that can be used as client deliverables. The screenshots below show the basic steps and a sample RTF output file.


In summary, maintaining the business descriptions for data elements within the data modeling tool has the following advantages:
  • The business descriptions will only have to be maintained in one place (i.e. in the data modeling tool).
  • The data dictionary is fully integrated into the meta data for database objects (if supported by the RDBMS).
  • An official data dictionary document or web page can easily be created by the data modeling tool.

Thursday, August 19, 2010

OBIEE 11g is now available to the general public!

The much anticipated new release of OBIEE 11g was made available last weekend. Oracle has been discussing this product and the conversion of OBIEE and Hyperion on their product roadmap for a while and it has finally come to fruition. While there is certainly more to come in terms of this integration, Oracle has taken giant steps forward with this release of OBIEE.

Guident attended an exclusive Partner Briefing in Redwood Shores, the launch event in NYC and has been digesting the new features and functionality to understand its application for our customers. In short, we are impressed with this release and excited about the possibilities with OBIEE 11g.

Key features of this release include:

  • User Interface – the new 11g user interface is more intuitive and easier to use as it is now task oriented as opposed to product module oriented.

  • Improved Visualization - Graphing and Mapping – 11g takes advantage of a new graphing engine, shared by the entire Fusion suite, providing a broader range of visually appealing, interactive charts and graphics. 11g also includes integration of GIS maps into the analytics through the use of Oracle MapViewer and Navteq map data.

  • Integration with Hyperion – 11g makes it easier than ever to report from an Essbase cube and to push data into an Essbase cube. It also provides calculation capabilities and hierarchical analytical capabilities that were previously only available with an OLAP tool.

  • Action Framework – 11g provides a revolutionary ability to move from insight to action through the use of richer guided analytics capabilities. 11g enables the seamless integration of external processes (e.g. SOA and BPEL workflow) within a BI analytic object. (e.g. call a process to place a Credit Hold directly from a report of Days Sales Outstanding).

  • Scorecarding – 11g provides new capabilities to provide strategy maps, cause and effect diagrams, and track targets, actual and variances for KPIs.

  • Smooth Upgrade – 11g requires a relatively easy upgrade as opposed to a full migration process.
Guident is beginning right away to work with our customers in planning out 11g upgrades, demonstrating the capabilities, and determining the best means for taking advantage of the new features provided. Stay tuned for upcoming webinars on these new features from Guident in the near future. Call us for any information or demonstrations of OBIEE 11g.

Wednesday, August 18, 2010

Multi-Developer OBI EE Environments

In an environment with more than two or three OBI EE developers, it becomes increasingly difficult to coordinate and control code changes and updates to the OBI EE catalog, repository, and BI Publisher XMLP content. The larger the development team, the more likely the chance of two developers updating the same report and inadvertently overwriting each other’s work.

Often, some type of control is enforced by dividing the content into separate areas of responsibility. For example, developer 1 is responsible for maintaining the repository, developer 2 is responsible for all accounting reports, and so on. However, this approach makes resource utilization planning difficult for project managers since work-loads are never equally distributed across the areas of responsibility.

Since OBI EE has no built-in source code control capability, one has to look for third party software that can add this capability to an OBI EE development environment. There are several options including Microsoft Visual SourceSafe, CVS, and Tortoise Subversion (TortoiseSVN), which is an open source version control tool that can be downloaded for free at http://tortoisesvn.net/.

Regardless of the tool, the solution boils down to version control on the OBI EE content files as depicted in the diagram below.


Developers run local instances of the OBI EE environment on their own workstations. All files and subfolders in the OBI EE web catalog folder, the BI Publisher XMLP folder, and the repository files are placed under source code control in a central master repository. Each workstation has a local repository that is synchronized with the master repository via update, check-in, and check-out operations.

The development server, which is mainly used by the business analysts for testing, is another subscriber to the master repository. A simple update from the repository will deploy the most current version to the development server.

Once a developer has checked-out a file, the file is locked in the master repository and no other developer is allowed to change the file until it is checked in again. Thus, no longer can one developer inadvertently overwrite changes of another. In addition, this approach provides the capability to roll back the environment to a previous version.

Saturday, August 7, 2010

eDiscovery - Your Next Crisis?

 For more information on this topic, refer to:

http://www.guident.com/ or contact the author directly at mailto:info@guident.com.

Crisis Brewing

Litigation has a long tradition in the US. Now, as firms and enterprises increasingly shift from paper to digital knowledge assets, that litigation trend is also moving into the digital arena. Ediscovery is a broad term applying to one of a series of responses to a legal "triggering event." That event starts begins an obligation to preserve and disclose data that may be due to a judicial order, or even the mere knowledge of a future legal proceeding that is likely to require preserving and finding relevant information stored in your electronic documents. In the Ediscovery world, these assets are now called Electronically Stored Information or ESI. Ediscovery is a relatively new concept. You could be excused if you are not familiar with the term. In the US, the Federal Rules of Civil Procedure or "FRCP" issued rule 26, and related rules, in December 2007. This update to the FRCP made all ESI "discoverable" just as non-electronic information, usually paper, is discoverable. ESI, eDiscovery, FRCP… these and related acronyms are enough to make your head swim. But keep your head above water and pay attention, because if you are not ready for eDiscovery, you could be in for some serious pain, both to your organization's bottom line and to its reputation.


In our view, eDiscovery is built on a series of tools and best practices that should be present in every enterprise and that everyone should proactively follow. Sadly, few actually do, because these tools and practices are often seen as optional, a distraction from the main business activities. The tools we refer to are Enterprise Content Management (ECM), Records Management (RM) and Search. The best practices, foundation for effective management of ESI, relate to the processes and procedures you follow to oversee all your ESI – records and non-records.

So how do you get started? Meet EDRM, the Electronic Discovery Reference Model, and its sibling, IMRM, the Information Management Reference Model. We told you this wouldn't be simple.

Reference Models


The EDRM group, responsible for both these reference models, is a consortium of vendors and other interested parties wanting to develop comprehensive guidelines, standards, and tools to reduce the incidence of eDiscovery nightmares, or provide ways to cope when they occur. The Electronic Discovery Reference Model (EDRM) provides guidelines, sets standards, and delivers resources to help those who purchase eDiscovery solutions and vendors who provide them, improving the quality of the tools and reducing the costs associated with eDiscovery.

IMRM, shown below, aims to "provide a common, practical, flexible framework to help organizations develop and implement effective and actionable information management programs. The IMRM Project, also part of the EDRM industry working group, aims to offer guidance to Legal, IT, Records Management, line-of-business leaders and other business stakeholders within organizations." This project within the EDRM group suggests ways to facilitate a common approach among these different groups to discuss and make decisions on the organization's information needs.


Although this diagram has the ring of endless numbers of PowerPoint slides you've seen on a variety of topics, it re-iterates some basic, commonsensical ideas that all should adopt but most ignore. We won't go into details about this, but the general themes are obvious. These various different business units, often at odds and seldom understanding each other's language and values, must work together to manage ESI, whether records or not. The result could be that eDiscovery nightmare. Some key takeaways: Decide and oversee the ways your organization creates and saves information. Throw away what isn't needed, keep what you must – all within the corporate requirements for both records and other ESI. IT will benefit (less to back up, archive, and index for search); Legal will be happy you are reducing risk; Records Management will appreciate getting all the help with ESI it can get; and business profits will be shielded somewhat from the risks of bad information management practices.

EDRM


Now what of the EDRM model itself? Again, this is not an easy concept but still critical to prepare for that inevitable crisis.

To understand this model, courtesy EDRM (edrm.net), read left to right and notice how the process sifts through huge volumes of ESI and aims to focus on the important, most relevant pieces. EDRM has eight ongoing projects to fill out the details of their goals to "establish guidelines, set standards, and delivering resources."


IMRM is related to the left-most process, "Information Management," but don't view it as a picture of Information Management itself. Instead, think of IMRM as a way of promoting cross-organizational dialog – always important, critical if that eDiscovery request comes a knocking.

So those two models give you the grand overview. In upcoming posts, we'll look at the elements of these models in greater detail. We also spoke with several leading eDiscovery tools vendors recently. We'll tell you their views and our impressions about the vendor involvement with EDRM in general. Are vendors just giving a new name to the same old products, or jumping onto the "next big thing" so they don't get left behind, or are they up to something truly useful , for eDiscovery and maybe morein this collaborative effort?

In a subsequent post we'll look at the first element of the EDRM model, Information Management. You'll see what vendors had to say and our assessment about how their views provide insights for you to get started preparing for, or better still avoiding, that next crisis.

For more information on this topic, refer to:

http://www.guident.com/ or contact the author directly at mailto:info@guident.com.


Friday, August 6, 2010

The Need for Performance and Portfolio Management

For more information on this topic, refer to:

http://www.guident.com/ or contact the author directly at mailto:info@guident.com.


With ever-increasing scrutiny of Federal IT initiatives’ performance (e.g., Federal CIO, Federal IT Dashboard, TechStat Sessions, Financial Systems Advisory Board, GAO reports, cancelled projects, etc.), the need for sound Portfolio Management and Performance Management is quickly coming to the forefront. Unfortunately, these disciplines often suffer from ill-defined processes, disjointed tools and inconsistent education. At the same time, agencies are banking on the success of their IT initiatives with large investments of time and resources. A cohesive solution of processes, tools and education is needed to bring the focus back to mission objectives and performance relative to those objectives.

What else do you believe are symptoms, contributors to this problem, and possible solutions?

Also, see the below Guident and Oracle webinar on our Project Performance Portfolio Management (PPFM) Solution.

http://www.guident.com/index.php?page=download&target=Managing_Projects_and_Budget_with_OBIEE_and_Primavera.pdf

For more information on this topic, refer to:

http://www.guident.com/ or contact the author directly at mailto:info@guident.com.

Tuesday, August 3, 2010

Oracle Analytic Functions in ODI

Oracle Analytic functions are a great way to write efficient, complex SQL statements. Instead of having to write multiple joins and subqueries you can write a similar statement in just one line. This is a great time saver especially when using a tool such as Oracle Data Integrator (ODI), which makes it difficult to do subqueries. Unfortunately, ODI’s knowledge modules do not support all analytic function out of the box. The problem is when ODI sees the SUM keyword it automatically triggers the use of the GROUP BY and HAVING clause regardless if is a regular SUM or analytical query SUM. If you ever tried using such a function in ODI you probably received “ORA-00979: not a GROUP BY expression”.

With just a few lines of code you can easily implement a solution to fix this issue:

1) Navigate to the KM you wish to customize to use analytic functions (can be either LKM or IKM).

2) Create a new KM Option


3) Open the knowledge module and navigate to the Details tab, “Load Data” step (or “Insert flow into I$ table” step for IKM).

4) In the Definition tab look for the lines of code that contains (either Command on Target or Source):

<%=snpRef.getGrpBy()%>
<%=snpRef.getHaving()%>

And replace it with the following

<% if (odiRef.getOption("USE_ANALYTIC_FUNCTION").equals("0")){
out.print(odiRef.getGrpBy());
out.print(odiRef.getHaving());
} else
{
out.print("--Group by functions are suppresses by KM");
}
%>


5) Click the option tab and be sure to check your option name (USE_ANALYTIC_FUNCTION). Click Okay to complete.
6) When creating your interface and choosing your KM, in the flow tab you now have the ability to select the user defined USE_ANALYTYIC_FUNCTION.

The USE_ANALYIC_FUNTION option works by suppressing the GROUP BY and HAVING clause of the query when the value of Yes is selected. Because the GROUP BY will not be used you can use any analytic function you like.

Thursday, July 15, 2010

Analytics in the Social Media Space

Will Analytics be an integral part of the social media space? According to the IT budgets of Fortune 500 companies, the analysis of customer online social interactions is taking center stage. Forrester reports: “Despite recession, more than 50 percent of marketers increase spending on social media”1.

Organizations have begun to realize that understanding potential customer’s online behavior is critical to staying one step ahead of the competition. Some online vendors have utilized this information to create personalized web content to better target potential customer groups. Collecting and analyzing online behavior and translating this information into reliable and actionable knowledge to support decision making is quite a challenge.


There are many tools on the market to support analytics for social media. Feature rich tools like Lyzasoft support searches; bookmarks; mixing, matching, and combining; tagging; sharing; commenting; and rating - with BI analytics. Open source tools like Google analytics which are not typically used for Social Media sites can be customized with an extension of Social Media Metrics for Web 2.0 social sites like Digg, StumbleUpon, del.icio.us and more. Industry leaders like IBM offer text analytics; SAS offers Social Media analytics, while niche vendors like Lexalytics offer Sentiment Analytics. These software products help organizations in converting online behavior and opinions into virtual currency by analyzing the deep rooted semantics and the context of every single word.

With so many products available in this space how does an Organization choose the right vendor to support their endeavors? Forrester lists of a few top attributes to look for in a Social Media BI vendor 2:
  • Reliable data collection
  • Easy-to-use Interface
  • Product pricing
  • Match between product capabilities and requirements
  • Quality of support
  • Data reporting assurance
  • Integration with other BI applications
Forrester also suggests these important data capabilities in the solution:
  • Custom metrics
  • Easy implementation / deployment
  • Benchmarking
  • Data warehouse
  • Ability to export data to other applications
  • Collection of full (no sampling) data
  • Administrative access controls
  • Ability to import data for blended analysis
It is safe to say that this area is swiftly moving to the top of the hype cycle. The next Web Analytics maturity wave intertwined with Web 2.0 will touch upon every single aspect of our lives from political campaigns to everyday dining. Just imagine, you are vacationing in an exotic island and your cell phone alerts you when you are within 5 miles of a restaurant your friend mentioned during a casual Facebook chat.


References:

1 - Despite Recession, More Than 50pct of Marketers Increase Spending on Social Media, Forrester Consulting, http://www.readwriteweb.com/enterprise/2009/03/despite-recession-more-than-50-of-marketers-increase-spending-on-social-media.php

2 - Appraising Investments in Web Analytics - A Commissioned Study Conducted by Forrester Consulting on Behalf of Google, Forrester Consulting, September 2009

Tuesday, June 22, 2010

Enterprise Search vs. a Centralized Electronic Information Repository

Enterprise Findability: Leveraging Synergies between the Common Electronic Repository and Enterprise Search

This paper describes synergies the organizations can achieve if Enterprise Content Management (ECM) and Enterprise Search technologies are considered and implemented together.

Many organizations are required to identify, retain, and share mission-critical information efficiently. Historically, individual departments in an organization took responsibility for assuring appropriate retention and access. However, the increasing complexity of regulation mean that this mission-critical information increasingly applies across entire organizations. Information in one department may be relevant to another department, as together they work to provide consolidated information to the external world.

A key challenge is to achieve the best use of information assets in its repositories. The goals are to eliminate duplicate content, maximize its reuse, and assure that information is protected and accessible. These goals summarize the concept of findability. In essence, findability is the art and science of locating information in or about electronic documents. People want to find answers, not search for them. AIIM, the industry Association for Imaging and Information Management, says in a 2008 report that “effective Findability retrieves content in context. Therein lies the crux of Findability. It cannot be attained simply by search, even a powerful search.” (AIIM MarketIQ, 2008). Improving findability requires a cooperative strategy, achieved by combining complementary technologies and systems. Findability is critical to effective use of information at many organizations.


No organization today can afford to duplicate assets or investments, whether in enterprise software or knowledge assets developed by its workers. Savvy organizations instead are adopting Information Lifecycle Management (ILM) practices. These ILM practices are “based on aligning the business value of information to the most appropriate and cost effective infrastructure.” (SNIA, 2004). ILM practices recognize that multiple technologies are critical to attaining desired organizational outcomes.

Findability Efforts at a Large Government Agency: An Overview

In 2006, a large federal government agency recognized the critical role of its information and resources by creating a Board to better coordinate IT investment. The board also initiated a set of enterprise-wide initiatives aimed at modernizing its IT systems. Among these initiatives is creation of a common electronic document repository, whose objective is to integrate individual repositories and contain the vast majority of documents created or received by the agency. This would:

1. Improve access to the content and its associated metadata, and


2. Facilitate reviewers’ and others’ ability to do their jobs effectively and efficiently.

More recently, the agency launched an Enterprise Search initiative to provide agency wide searches of its information repositories, one of which would be the Common electronic repository.

These two unfolding projects position the agency to plan and implement them in concert to meet Information Lifecycle Management best practices: increase findability, with maximum effectiveness and minimum cost.

Here is how both support findability.

Findability: Concepts and Technologies

Because of their interlocking components, a variety of technologies can enhance findability. Organizations seeking to enhance findability should select whatever combination of technologies that best meet their needs. The agency has already determined that two critical, enterprise technologies are needed to attain findability: Common electronic repository and Enterprise Search. Together these can overcome an agency's findability challenges:

1. Multiple silos of information that segregate potentially useful content into individual repositories,


2. Multiple sets of metadata and terminology, making it challenging to identify all potentially relevant content,


3. Rapid growth in content that burdens storage and hinders implementing electronic record policies.

Attributes, properties, and metadata all refer to the same thing: information about, not inside, the content. Both a Centralized Electronic repository and Enterprise Search will use metadata. Organizations will enable employees to find and use what they need and when they need it by identifying the synergies of these two systems.


How the Centralized Electronic Repository Enhances Findability


A Common Electronic Repository increases findability by:


1. Providing a hierarchical folder structure that shows content groupings and relationships


2. Associating metadata with content, providing document context and enhancing internal search of the content


3. Supporting the setting of security levels and other access controls

As an ECM system, the Common Electronic repository provides a hierarchical folder structure (or taxonomy) for content storage. By merely looking at this taxonomy, users can understand important content groupings and their relationships.

Another key feature of ECM systems for a Common Electronic Repository is their capability to associate metadata with content. Metadata adds additional context to the content, helping users better understand how, when and why the content was created. For example, each piece of content in a Common Electronic Repository will have several common metadata attributes such as “Document Authors,” indicating whom to contact for more information.

Metadata can be designed to use controlled, predefined lists of keywords. A specific attribute such "drug additive" could contain only one of a small set of values. By constraining the list of values with one like “Drug Evaluation and Research,” Enterprise Search will return more relevant results. Enterprise Search would not need lists of synonymous names.

A Common Electronic Repository also supports the setting of security levels and other access controls. These also can provide context for the content. Content might be considered available for limited release, such as within a specific research group, or have constrained usage based on specific time periods. Access controls also reduce visual clutter, since users see only what they have rights to see, and they can change content only as policy permits.

In summary, a Common Electronic Repository will enhance findability. The system’s folder structure and metadata are shared. Folders provide additional relevant context. The system allows content to cross organizational boundaries, enhancing findability. The organization also establishes a shared understanding of the domain and its content.


How Enterprise Search Enhances Findability


Enterprise Search will also play an important role in findability. That is why enterprise search systems are among the first technologies organizations consider as they wrestle with findability challenges. The most basic enterprise search function is to generate indexes for content items. For example, search systems generate indexes of key words to search content. Search systems also provide relevance ranking. However, credible relevance ranking requires advanced Enterprise Search features. Incorporating these advanced features adds additional value to findability:

• Create and manage organization specific thesauri. This helps a user searching for a specific word missing from documents of interest. Thesauri help the search systems return all documents of interest by finding those containing words meaning the same, but spelled differently, from what the user searched for.


• Support Term weighting. This identifies those terms that center users might find more important than others, when all have similar meanings. Term weighting, combined with Thesaurus support, enhances findability.


• Provide natural language processing. This allows Search to analyze content beyond merely identifying key words. For example, a document that contains the word “bush” could be analyzed to determine whether it was about a United States president or a type of vegetation.

Since a Common Electronic Repository will contain both internal and external content from large numbers of sources, the Enterprise Search system’s natural language support will help searchers sift through these different kinds of information.

Because Search systems work with indexes created from content throughout the enterprise, they can find relevant content no matter where it is stored. No navigation through a pre-set folder structure is needed. Such navigation requires choices which may not be intuitive when a user is not familiar with the domain.

In summary, Enterprise Search will play an important role in meeting an organization’s findability needs. Because an organization cannot pre-determine all relevant organizational structures, or other context for content, Enterprise Search will provide the opportunity to avoid dealing with specific folder structures, such as those in a Common Electronic Repository, and still find useful content.


A Common Electronic Repository Provides Value to Enterprise Search

One of the limitations of any enterprise search system is its brute-force nature. Search systems operate primarily on individual words, which by themselves are isolated from context. The result is that users often have to wade through large lists of search results to find what they really are looking for. An Electronic Content Management system is a good source of context to add value to a Enterprise search engine and can also reduce the length of those lists. A Common Electronic Repository can help organize search results by providing groups (“facets”) of Enterprise Search results. A good source of those facets is the Electronic Repository folder taxonomy.

Enterprise search systems can also use folder names to refine search results by allowing a search restricted to a particular branch in a folder hierarchy. Many search engines also allow advanced use of dictionaries and thesauri. Since every organization is unique, these dictionaries are generally not available “out-of-the-box” but instead must be built to reflect the organization’s vocabularies. However, a Common Electronic Repository folder structure could serve as an initial set of preferred terminology for Enterprise Search dictionaries, rather than requiring an organization to create that starter dictionary from scratch.

Enterprise Search can index metadata in a Common Electronic Repository to focus the types of searches available, again providing context to the content. The investment made adding rich metadata values to a Common Electronic Repository becomes immediately available to Enterprise Search. For example, a user might want to see content related to the a specific drug Lisinopril, but only when that document was written as part of a site inspection.

By making use of Common Electronic Repository metadata, an Enterprise Search query could say in effect “show me only those documents containing the word ‘Lisinopril’ which also have been tagged as a ‘site inspection’.”


Search provides value to ECM

Just as the Common EDR will add value to Enterprise Search, Enterprise Search can greatly enhance the value of an Common Electronic Repository. Like all ECM systems, a common Electronic Repository provides structures to store and process content according to an organization’s business rules. However, a Common Electronic Repository can provide only rudimentary searching.

• Enterprise Search will provide richer searching than basic search that is part of the Common Electronic Repository. By reusing metadata already describing content in the Common Electronic Repository, Enterprise Search can provide more relevant search results.

• By supporting dictionaries (such as lists of synonyms), Enterprise Search can provide additional ways to find content when the Common Electronic Repository folder names don’t match a user’s search query.

Enterprise Search will also provide a findability alternative to navigating a Common Electronic Repository folders. Rich Enterprise Search features can even allow a searcher to influence the search process to create his or her own context, as opposed to the one represented by the single Common EDR folder structure.

Lastly, Enterprise Search will provide another important feature: search logs. Search logs provide a record of what search queries users ran. Search administrators can analyze these logs to show how content is used, and logs can even suggest possible changes to the Common Electronic Repository folder structure, metadata elements and values.
Leveraging the Synergies

To repeat, neither Enterprise Search nor a Common Electronic Repository alone can provide a complete findability solution. Implemented together, they not only support richer findability, they do so more efficiently than either by itself.

A Common Electronic Repository, with its pre-set folder structure, and Enterprise Search with its ability to cross storage locations, provide two different approaches to finding content. Both approaches will be valuable depending on each user’s particular needs. One person familiar with the Common Electronic Repository folders may find navigating its folders faster and more effective than using Enterprise Search, which might seem more “scattershot.” Another person, unfamiliar with the Common Electronic Repository, could prefer Enterprise Search for rapidly finding relevant content. For that user, navigating through unfamiliar folders and reviewing content within each folder might be cumbersome.

A key operational challenge for deploying any enterprise search system is building connections to various ECM systems and translating their metadata elements to those used in the Search system. Integrating most content into one repository, the Common Electronic Repository, reduces the number of bridges and maps for Enterprise Search. This in turn reduces initial implementation cost as well as ongoing maintenance costs. Failure to consolidate content into the Common Electronic Repository would increase costs as the number and size of island repositories increases. Enterprise Search system administrators would have to spend ever-increasing resources to maintain those ECM system bridges and maps. Over time, the result would be a babble of inconsistencies, reduced relevancy, and decreased confidence in the Enterprise Search system’s results.

Deploying both a Common Electronic Repository and an Enterprise Search system also reduces the costs of governance for each. A single set of centralized governance processes applied to Common Electronic Repository content and folder structures minimizes costs, since only one folder structure needs to be reviewed, updated, and managed. Enterprise Search system governance decreases since metadata and the meaning of taxonomy nodes in the Common Electronic Repository are stable, predictable, and understood by Enterprise Search users.


Conclusions

With a Common Electronic Repository and Enterprise Search working together, they achieve findability levels unavailable to each alone. Each system brings unique advantages to enhancing findability. Implementing both Enterprise Search and a Common Electronic Repository is critical to reducing costs, getting best use from technology investments, and achieving the level of findability that an organization's mission requires.

References

AIIM MarketIQ (Q2 2008) “Findability: The Art and Science of Making Content Easy to Find. http://www.aiim.org/Research/MarketIQ/Findability-7-16-08.aspx

SNIA: Storage Networking Industry Association. (2004). Information Lifecycle Management: A Vision for the Future. http://www.snia.org/forums/dmf/programs/ilmi/ilm_docs/SRC-Profile_ILM_Vision_3-29-04.pdf (accessed March 10, 2010).

For more information on these topics, go to http://www.guident.com/ or contact the author directly at mailto:rweiner@guident.com.

Friday, June 11, 2010

Redundancy in the BI Data Model

Recently, an experienced database professional who had just started his first business intelligence (BI) project asked me two questions:
  1. Is data redundancy allowed in a BI data model?
  2. How much normalization is industry standard in BI if at all?
I had no hesitation answering the first question. Yes, absolutely, data redundancy is not only allowed but is recommended in many situations in BI data models. Redundancy is the key to simple BI data models and fast query response. The rules of normalization, which minimize data redundancy, were designed with transaction processing systems in mind and were also designed at a time when computer resources were scarce and expensive and data storage devices had limited capacity and slow I/O speeds.


One of the primary goals of normalizing to eliminate redundancy was to ensure data consistency. You didn't want to capture the same data at multiple entry points, since this meant extra effort of people typing in what should be the same data but often wasn't because of typos and variations in usage of abbreviations, nicknames, etc. Second, if the data changed and you had redundancy in the data model you had to go back to update multiple records in many tables - not necessarily easy to program and manage. Third normal form data models eliminate these problems and store data efficiently, but not without a price. The proliferation of tables with third normal form means queries have to join many tables. This is no big deal for transaction processing activity because individual transactions only insert or update a handful of rows in each table and typically use procedural code to do this.

With BI data models we don't care about capturing data. That is the job of the source application. So long as the source did a good job of normalizing and capturing the data properly, the BI model does not need to repeat the normalization process to ensure good source data. Second we are not supposed to update records in BI models - data warehouses are supposed to be static. We preserve point-in-time history so we typically don't have to go back and make updates to multiple occurrences of redundant data.

BI queries are very different from source transactions. Having to join many tables in a non-procedural SQL query has a huge cost when you are talking about queries that touch hundreds of thousands or even millions of records which is common for BI. Therefore redundancy that eliminates table joins for runtime queries is a recommended practice in BI. Fewer tables in the model also make it easier for end users to understand the model and easier to write ad hoc queries. Dimensional data modeling featuring the use of star schemas which may include redundancy is the technique most frequently used to reduce the number of tables in the model.

Other examples of acceptable redundancy in BI databases include having the same data stored in staging tables as well as production tables. And having variations of the same data stored in summary tables with different levels of aggregation so standard reports that frequently use the aggregated data run faster.

The answer to the second question is not so easy. There are two diametrically opposed schools of thought on data modeling for data warehousing. The one school, associated with Bill Inmon who is often called the father of data warehousing, believes that data warehouses should first acquire and store all data in non-redundant third normal form. They believe this is still required for good data management practices and do not believe that dimensional data models are robust enough for large data warehouses. However since BI tools like Business Objects and MicroStrategy run best with dimensional models, once the data is safely stored in a third normal form warehouse the model is extended with redundant downstream dimensional data marts that re-extract and reload data out of the data warehouse model into the data mart models.

The other school of thought, associated with Ralph Kimball who is one of the pioneers of dimensional data modeling, believes that dimensional models are perfectly capable of managing data of any size and complexity and are suitable for data warehouses or data marts no matter their size. Followers of this school avoid the extra effort of designing and maintaining two models (one third normal and one downstream dimensional) and two ETL jobs to load the two models. Consequently they also typically deliver new BI projects with shorter development cycles.

Friday, May 28, 2010

BusinessObjects XI - Prompt for Section Headers

BusinessObjects Web Intelligence reports can’t prompt the end users for section headers on a report using its built-in features. However, this can be achieved by using the advanced report creation technique demonstrated below.

  • Dynamically section a report based on Prompt response
  • Requires new objects in universe


  • Create query, using new objects
  • Run the query, selecting a different object for each section

  • Create a variable for each section


Section 1 Object:
=If([Section 1]="Lines";[Lines];If([Section 1]="State";[State];[Year])
)
Section 2 Object:
=If([Section 2]="Lines";[Lines];If([Section 2]="State";[State];[Year])
)
Section 3 Object:
=If([Section 3]="Lines";[Lines];If([Section 3]="State";[State];[Year])
)


  • Finally, section the report on the 3 new variables