Friday, December 18, 2009

OBIEE: Seeding the Dashboards for End Users and Purging on Nightly Basis

Many dashboards on most systems can be seeded with an iBot that runs overnight and caches the reports to the dashboards for quick access and less queries to the database. We created a series of iBots that are triggered by an initial iBot the purges the old Cache and starts the process of reseeding the data. First we created the iBot Purge Cache:


This iBot is run at 5:00am every night after the ETL completion by the Administrator user. The delivery content is the first report we needed to cache. The destination for the iBot is the Oracle BI Server Cache.


Notice in the Advanced section the javascript purgeSASCache.js, Below are the parameters that were set in the Advanced tab.


The javascript purgeSASCache.js should be placed in the folder OracleBI/Server/Scripts/Common
The below is the javascript file:


outStream.Close();
return output;
}
//////////////////////////////////////////////////////////
// Get WshShell object and run nqCmd. Capture the output
// so that we can handle erroneous conditions.
var wshShell = new ActiveXObject("WScript.Shell");
// Create a temp file to input the SQL statement.
var fso = new ActiveXObject("Scripting.FileSystemObject");
var tempFolder = fso.GetSpecialFolder(2);
var tempInFileName = fso.GetTempName();
var tempOutFileName = fso.GetTempName();
tempInFileName = tempFolder + "\\" + tempInFileName;
tempOutFileName = tempFolder + "\\" + tempOutFileName;
var tempInFile = fso.CreateTextFile(tempInFileName, true);
tempInFile.WriteLine(sqlStatement);
tempInFile.Close();
try
{
// execute
var dosCmd = nqCmd + " -d \"" + dsn + "\" -u \"" + user
+ "\" -p \"" + pswd + "\" -s \"" + tempInFileName + "\"" +
" -o \"" + tempOutFileName + "\"";
wshShell.Run(dosCmd, 0, true);
var output = GetOutput(fso, tempOutFileName);
// Remove the temp files
fso.DeleteFile(tempInFileName);
if (fso.FileExists(tempOutFileName)) {
fso.DeleteFile(tempOutFileName);
}
// Check the output for any errors
if (output.indexOf("Processed: 1 queries") == -1) {
ExitCode = -1;
Message = output;
}
else if (output.indexOf("Encountered") != -1) {
ExitCode = -2;
Message = output;
}
else {
ExitCode = 0;
}
} catch (e) {

if (fso.FileExists(tempInFileName)) {
fso.DeleteFile(tempInFileName);
}
if (fso.FileExists(tempOutFileName)) {
fso.DeleteFile(tempOutFileName);
}
throw e;
}

Wednesday, December 2, 2009

Integrating OBIEE and Google Maps with the MarkerClusterer API

Since we have started to integrate Google maps into an OBIEE application, the users have requested the ability to look at a Map of the US and see concentrations of points on a map. They wanted to see at a national level where the companies they were interested in were located. They also wanted the ability to zoom in and see exactly where each facility was located. The solution we chose to meet the requirement was the Google maps and the Marker Cluster API found here: Gmaps utility library

The way the code works as described by the creator: “MarkerClusterer collects markers into different clusters and displays the number of markers in each cluster with a label, creating new clusters as the map zoom level changes. The clustering algorithm is simple; for each new marker it sees, it either puts it inside a pre-existing cluster, or it creates a new cluster if the marker doesn’t lie within the bounds of any current cluster.”

So for our project we took a set of about 10,000 facility locations and attempted to map them but found the first limitation of JavaScript being that most clients will freeze if you plot over 6,000 or so points. So we gave the users the ability to filter the data on several criteria to limit the number of points in the map and placed a governor on the number of points by setting max rows to 3000. Below is the top zoom level view of the data set we started with:


You will notice that the default clustering algorithm has 3 colors representing clusters of more than 100 (Red), 10 to 99 (Yellow) and 2 to 9 (Blue). A single location will be represented with a tear drop icon. So now instead of seeing 3,000 separate points there are about 30 clusters on the map. The eye is quickly drawn to the northeast with its multiple red clusters. Now to meet the requirements a user can zoom in anywhere on the map and the clusters re-calculate.


So we have seen how the code works, below is the steps used to implement this on our project.

  1. First we geocoded our addresses and stored latitudes and longitudes for each data point we wanted to map. If you do not geocode the addresses you really need to work with less points (less than 1000) and the results will take much longer.
  2. Then we created a query that has the company facility name and internal company number (used for navigation), lat and long, and a piece of data called rank for displaying on the single points in the map. The RSUM(1) is used for displaying if more that 3000 rows could be displayed in the map.


The heavy lifting is done in a narrative view using JavaScript, the Google maps API, and the MarkerCluster API
  1. Get a Google Maps API Key from: http://code.google.com/apis/maps/signup.html - Google maps API uses a key generated based on the IP and name from the calling server, so be sure you are on your web server when obtaining this. Get a key based on your own OBIEE server address.
  2. Create a narrative view and make sure you mark the contains HTML Markup checkbox


In the Prefix box add the following code: (See the red text comments that explain parts of the code)


Prefix Text:


[]
<html>
<head>
<script src="http://maps.google.com/maps?file=api&v=2.x&client=gme-dotdc&sensor=false" type="text/javascript"></script> //GOOGLE API
<script type="text/javascript">
var map1 = null;
var count = 1;
var point1 = null;
var marker;
var markers = [];
function initialize1(comp_facility, lat, long, row_wid, cnt, rank)
{

if (count == 1)
{
if (GBrowserIsCompatible())
{
map1 = new GMap2(document.getElementById(1),{size:new GSize(900,600)});
map1.setCenter(new GLatLng(39.5, -98.35), 4); //Center Map on US
map1.addControl(new GLargeMapControl());
map1.addControl(new GMapTypeControl());
markerClusterer = new MarkerClusterer(map1);
count = 0;
alert("Due to the large volume of Data this Report may take upto 5 Min to display the Map. Please do not close the browser."); //A Warning to users that the map generation may take time
}
}
point1 = new GLatLng(lat, long); // Creates the data point to display
// marker = new GMarker(point1);
marker = createMarker(point1, row_wid, comp_facility, rank); // Text to display on popup
markers.push(marker); // Type of marker for a single location

if (cnt == 1 )
{
var markerCluster = new MarkerClusterer(map1, markers);
}

}


function createMarker(point, int_num,cmp_facility, cmp_rank)
{

var marker = new GMarker(point);
GEvent.addListener(marker, "click", function() {marker.openInfoWindowHtml("<a href = http://www.yoururlhere.com/analytics/saw.dll?Dashboard&PortalPath=/shared/Safety%20Maps/_portal/Safety%20Maps&Page=Navigation&Action=Navigate&col1=Company.%22Internal%20Company%20Number%22&val1="+ int_num + " target=\"_blank\">" + cmp_facility +"<br/><center>" + "Company Rank: " + cmp_rank + "</center></a>");});
return marker; //On click event will take user to a OBIEE dashboard
}


function MarkerClusterer(map, opt_markers, opt_opts) {
// private members
var clusters_ = [];
var map_ = map;
var maxZoom_ = null;
var me_ = this;
var gridSize_ = 60;
var sizes = [53, 56, 66, 78, 90];
var styles_ = [];
var leftMarkers_ = [];
var mcfn_ = null;

var i = 0;
for (i = 1; i <= 5; ++i) {
styles_.push({
'url': "http://gmaps-utility-library.googlecode.com/svn/trunk/markerclusterer/images/m" + i + ".png", //location of the cluster graphics
'height': sizes[i - 1],
'width': sizes[i - 1]
});
} //code for generating the clusters

if (typeof opt_opts === "object" && opt_opts !== null) {
if (typeof opt_opts.gridSize === "number" && opt_opts.gridSize > 0) {
gridSize_ = opt_opts.gridSize;
}
if (typeof opt_opts.maxZoom === "number") {
maxZoom_ = opt_opts.maxZoom;
}
if (typeof opt_opts.styles === "object" && opt_opts.styles !== null && opt_opts.styles.length !== 0) {
styles_ = opt_opts.styles;
}
}


function addLeftMarkers_() {
if (leftMarkers_.length === 0) {
return;
}
var leftMarkers = [];
for (i = 0; i < leftMarkers_.length; ++i) {
me_.addMarker(leftMarkers_[i], true, null, null, true);
}
leftMarkers_ = leftMarkers;
}


this.getStyles_ = function () {
return styles_;
};


this.clearMarkers = function () {
for (var i = 0; i < clusters_.length; ++i) {
if (typeof clusters_[i] !== "undefined" && clusters_[i] !== null) {
clusters_[i].clearMarkers();
}
}
clusters_ = [];
leftMarkers_ = [];
GEvent.removeListener(mcfn_);
};

function isMarkerInViewport_(marker) {
return map_.getBounds().containsLatLng(marker.getLatLng());
}


function reAddMarkers_(markers) {
var len = markers.length;
var clusters = [];
for (var i = len - 1; i >= 0; --i) {
me_.addMarker(markers[i].marker, true, markers[i].isAdded, clusters, true);
}
addLeftMarkers_();
}


this.addMarker = function (marker, opt_isNodraw, opt_isAdded, opt_clusters, opt_isNoCheck) {
if (opt_isNoCheck !== true) {
if (!isMarkerInViewport_(marker)) {
leftMarkers_.push(marker);
return;
}
}

var isAdded = opt_isAdded;
var clusters = opt_clusters;
var pos = map_.fromLatLngToDivPixel(marker.getLatLng());

if (typeof isAdded !== "boolean") {
isAdded = false;
}
if (typeof clusters !== "object" || clusters === null) {
clusters = clusters_;
}

var length = clusters.length;
var cluster = null;
for (var i = length - 1; i >= 0; i--) {
cluster = clusters[i];
var center = cluster.getCenter();
if (center === null) {
continue;
}
center = map_.fromLatLngToDivPixel(center);

// Found a cluster which contains the marker.
if (pos.x >= center.x - gridSize_ && pos.x <= center.x + gridSize_ &&
pos.y >= center.y - gridSize_ && pos.y <= center.y + gridSize_) {
cluster.addMarker({
'isAdded': isAdded,
'marker': marker
});
if (!opt_isNodraw) {
cluster.redraw_();
}
return;
}
}

// No cluster contain the marker, create a new cluster.
cluster = new Cluster(this, map);
cluster.addMarker({
'isAdded': isAdded,
'marker': marker
});
if (!opt_isNodraw) {
cluster.redraw_();
}

// Add this cluster both in clusters provided and clusters_
clusters.push(cluster);
if (clusters !== clusters_) {
clusters_.push(cluster);
}
};

this.removeMarker = function (marker) {
for (var i = 0; i < clusters_.length; ++i) {
if (clusters_[i].remove(marker)) {
clusters_[i].redraw_();
return;
}
}
};

this.redraw_ = function () {
var clusters = this.getClustersInViewport_();
for (var i = 0; i < clusters.length; ++i) {
clusters[i].redraw_(true);
}
};

this.getClustersInViewport_ = function () {
var clusters = [];
var curBounds = map_.getBounds();
for (var i = 0; i < clusters_.length; i ++) {
if (clusters_[i].isInBounds(curBounds)) {
clusters.push(clusters_[i]);
}
}
return clusters;
};

this.getMaxZoom_ = function () {
return maxZoom_;
};

this.getMap_ = function () {
return map_;
};

this.getGridSize_ = function () {
return gridSize_;
};

this.getTotalMarkers = function () {
var result = 0;
for (var i = 0; i < clusters_.length; ++i) {
result += clusters_[i].getTotalMarkers();
}
return result;
};

this.getTotalClusters = function () {
return clusters_.length;
};

this.resetViewport = function () {
var clusters = this.getClustersInViewport_();
var tmpMarkers = [];
var removed = 0;

for (var i = 0; i < clusters.length; ++i) {
var cluster = clusters[i];
var oldZoom = cluster.getCurrentZoom();
if (oldZoom === null) {
continue;
}
var curZoom = map_.getZoom();
if (curZoom !== oldZoom) {

// If the cluster zoom level changed then destroy the cluster
// and collect its markers.
var mks = cluster.getMarkers();
for (var j = 0; j < mks.length; ++j) {
var newMarker = {
'isAdded': false,
'marker': mks[j].marker
};
tmpMarkers.push(newMarker);
}
cluster.clearMarkers();
removed++;
for (j = 0; j < clusters_.length; ++j) {
if (cluster === clusters_[j]) {
clusters_.splice(j, 1);
}
}
}
}

// Add the markers collected into marker cluster to reset
reAddMarkers_(tmpMarkers);
this.redraw_();
};


this.addMarkers = function (markers) {
for (var i = 0; i < markers.length; ++i) {
this.addMarker(markers[i], true);
}
this.redraw_();
};

// initialize
if (typeof opt_markers === "object" && opt_markers !== null) {
this.addMarkers(opt_markers);
}

// when map move end, regroup.
mcfn_ = GEvent.addListener(map_, "moveend", function () {
me_.resetViewport();
});
}


function Cluster(markerClusterer) {
var center_ = null;
var markers_ = [];
var markerClusterer_ = markerClusterer;
var map_ = markerClusterer.getMap_();
var clusterMarker_ = null;
var zoom_ = map_.getZoom();

this.getMarkers = function () {
return markers_;
};

this.isInBounds = function (bounds) {
if (center_ === null) {
return false;
}

if (!bounds) {
bounds = map_.getBounds();
}
var sw = map_.fromLatLngToDivPixel(bounds.getSouthWest());
var ne = map_.fromLatLngToDivPixel(bounds.getNorthEast());

var centerxy = map_.fromLatLngToDivPixel(center_);
var inViewport = true;
var gridSize = markerClusterer.getGridSize_();
if (zoom_ !== map_.getZoom()) {
var dl = map_.getZoom() - zoom_;
gridSize = Math.pow(2, dl) * gridSize;
}
if (ne.x !== sw.x && (centerxy.x + gridSize < sw.x || centerxy.x - gridSize > ne.x)) {
inViewport = false;
}
if (inViewport && (centerxy.y + gridSize < ne.y || centerxy.y - gridSize > sw.y)) {
inViewport = false;
}
return inViewport;
};

this.getCenter = function () {
return center_;
};

this.addMarker = function (marker) {
if (center_ === null) {
/*var pos = marker['marker'].getLatLng();
pos = map.fromLatLngToContainerPixel(pos);
pos.x = parseInt(pos.x - pos.x % (GRIDWIDTH * 2) + GRIDWIDTH);
pos.y = parseInt(pos.y - pos.y % (GRIDWIDTH * 2) + GRIDWIDTH);
center = map.fromContainerPixelToLatLng(pos);*/
center_ = marker.marker.getLatLng();
}
markers_.push(marker);
};

this.removeMarker = function (marker) {
for (var i = 0; i < markers_.length; ++i) {
if (marker === markers_[i].marker) {
if (markers_[i].isAdded) {
map_.removeOverlay(markers_[i].marker);
}
markers_.splice(i, 1);
return true;
}
}
return false;
};

this.getCurrentZoom = function () {
return zoom_;
};

this.redraw_ = function (isForce) {
if (!isForce && !this.isInBounds()) {
return;
}

// Set cluster zoom level.
zoom_ = map_.getZoom();
var i = 0;
var mz = markerClusterer.getMaxZoom_();
if (mz === null) {
mz = map_.getCurrentMapType().getMaximumResolution();
}
if (zoom_ >= mz || this.getTotalMarkers() === 1) {

// If current zoom level is beyond the max zoom level or the cluster
// have only one marker, the marker(s) in cluster will be showed on map.
for (i = 0; i < markers_.length; ++i) {
if (markers_[i].isAdded) {
if (markers_[i].marker.isHidden()) {
markers_[i].marker.show();
}
} else {
map_.addOverlay(markers_[i].marker);
markers_[i].isAdded = true;
}
}
if (clusterMarker_ !== null) {
clusterMarker_.hide();
}
} else {
// Else add a cluster marker on map to show the number of markers in
// this cluster.
for (i = 0; i < markers_.length; ++i) {
if (markers_[i].isAdded && (!markers_[i].marker.isHidden())) {
markers_[i].marker.hide();
}
}
if (clusterMarker_ === null) {
clusterMarker_ = new ClusterMarker_(center_, this.getTotalMarkers(), markerClusterer_.getStyles_(), markerClusterer_.getGridSize_());
map_.addOverlay(clusterMarker_);
} else {
if (clusterMarker_.isHidden()) {
clusterMarker_.show();
}
clusterMarker_.redraw(true);
}
}
};

this.clearMarkers = function () {
if (clusterMarker_ !== null) {
map_.removeOverlay(clusterMarker_);
}
for (var i = 0; i < markers_.length; ++i) {
if (markers_[i].isAdded) {
map_.removeOverlay(markers_[i].marker);
}
}
markers_ = [];
};

this.getTotalMarkers = function () {
return markers_.length;
};
}

function ClusterMarker_(latlng, count, styles, padding) {
var index = 0;
var dv = count;
while (dv !== 0) {
dv = parseInt(dv / 10, 10);
index ++;
}

if (styles.length < index) {
index = styles.length;
}
this.url_ = styles[index - 1].url;
this.height_ = styles[index - 1].height;
this.width_ = styles[index - 1].width;
this.textColor_ = styles[index - 1].opt_textColor;
this.anchor_ = styles[index - 1].opt_anchor;
this.latlng_ = latlng;
this.index_ = index;
this.styles_ = styles;
this.text_ = count;
this.padding_ = padding;
}

ClusterMarker_.prototype = new GOverlay();

ClusterMarker_.prototype.initialize = function (map) {
this.map_ = map;
var div = document.createElement("div");
var latlng = this.latlng_;
var pos = map.fromLatLngToDivPixel(latlng);
pos.x -= parseInt(this.width_ / 2, 10);
pos.y -= parseInt(this.height_ / 2, 10);
var mstyle = "";
if (document.all) {
mstyle = 'filter:progid:DXImageTransform.Microsoft.AlphaImageLoader(sizingMethod=scale,src="' + this.url_ + '");';
} else {
mstyle = "background:url(" + this.url_ + ");";
}
if (typeof this.anchor_ === "object") {
if (typeof this.anchor_[0] === "number" && this.anchor_[0] > 0 && this.anchor_[0] < this.height_) {
mstyle += 'height:' + (this.height_ - this.anchor_[0]) + 'px;padding-top:' + this.anchor_[0] + 'px;';
} else {
mstyle += 'height:' + this.height_ + 'px;line-height:' + this.height_ + 'px;';
}
if (typeof this.anchor_[1] === "number" && this.anchor_[1] > 0 && this.anchor_[1] < this.width_) {
mstyle += 'width:' + (this.width_ - this.anchor_[1]) + 'px;padding-left:' + this.anchor_[1] + 'px;';
} else {
mstyle += 'width:' + this.width_ + 'px;text-align:center;';
}
} else {
mstyle += 'height:' + this.height_ + 'px;line-height:' + this.height_ + 'px;';
mstyle += 'width:' + this.width_ + 'px;text-align:center;';
}
var txtColor = this.textColor_ ? this.textColor_ : 'black';

div.style.cssText = mstyle + 'cursor:pointer;top:' + pos.y + "px;left:" +
pos.x + "px;color:" + txtColor + ";position:absolute;font-size:11px;" +
'font-family:Arial,sans-serif;font-weight:bold';
div.innerHTML = this.text_;
map.getPane(G_MAP_MAP_PANE).appendChild(div);
var padding = this.padding_;
GEvent.addDomListener(div, "click", function () {
var pos = map.fromLatLngToDivPixel(latlng);
var sw = new GPoint(pos.x - padding, pos.y + padding);
sw = map.fromDivPixelToLatLng(sw);
var ne = new GPoint(pos.x + padding, pos.y - padding);
ne = map.fromDivPixelToLatLng(ne);
var zoom = map.getBoundsZoomLevel(new GLatLngBounds(sw, ne), map.getSize());
map.setCenter(latlng, zoom);
});
this.div_ = div;
};

ClusterMarker_.prototype.remove = function () {
this.div_.parentNode.removeChild(this.div_);
};

ClusterMarker_.prototype.copy = function () {
return new ClusterMarker_(this.latlng_, this.index_, this.text_, this.styles_, this.padding_);
};

ClusterMarker_.prototype.redraw = function (force) {
if (!force) {
return;
}
var pos = this.map_.fromLatLngToDivPixel(this.latlng_);
pos.x -= parseInt(this.width_ / 2, 10);
pos.y -= parseInt(this.height_ / 2, 10);
this.div_.style.top = pos.y + "px";
this.div_.style.left = pos.x + "px";
};

ClusterMarker_.prototype.hide = function () {
this.div_.style.display = "none";
};

ClusterMarker_.prototype.show = function () {
this.div_.style.display = "";
};

ClusterMarker_.prototype.isHidden = function () {
return this.div_.style.display === "none";
}
</script>
</head>
<body>


 Narrative text:


Narrative Text:

[]
<div id="1" > <script type="text/javascript"> initialize1('@1','@3','@4','@5','@6','@2') </script>
</div>


Note the@ numbers are in the order of the function call in the prefix:
function initialize1(comp_facility, lat, long, row_wid, cnt, rank)

Finally in the PostFix add:


Postfix Text:

[]
</body>
</html>

And set the max rows to a number less than 5000.

The next blog I will show how to use the single points on the map to drill down into another dashboard in OBIEE.

Wednesday, November 18, 2009

Extend OBIEE Charts – Part 1: Google Chart API

OBIEE Answers provides quite a number of useful charts but it’s always nice to have a few additional options, which is the reason for this entry.   A few of our clients have expressed an interest in seeing heat Maps, Spark Lines, Bullet Graphs, and several more custom graphs embedded within OBIEE.   For this entry, we’ll take a look at Google’s Chart API and show you how we’ve integrated Google Charts within OBIEE Answers.

The Google Chart API allows you to dynamically generate your graphs by simply passing the parameters to an URL and in turn, Google Chart will respond with a PNG-image of your chart. You can then embed this image in tag anywhere in a webpage. For more information on the Chart API see here.

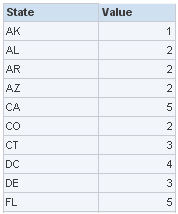
In this illustration, we will create a heat map using US map and data from one of our OBIEE Answers request. Here is the table:

(first column contains US state abbreviations and the second is just a random number from 1 to 6)


Now insert a Narrative view and writing the following codes to its corresponding sections:

Prefix section:

<!--first show a dummy map-->
<img src="http://chart.apis.google.com/chart?cht=t&chm=usa&chs=440x220" id="GD_mapImg"/>


<script type="text/javascript">
  // setting up parameters
  var chartURL = "http://chart.apis.google.com/chart?cht=t&chtm=usa&chs=440x220&chds=1,6";
  var chartBGColor = "&chf=bg,s,EAF7FE";

  //specify the gradient: <default color>, <start of gradient>,.., <end of gradient>
  var chartPalette = "&chco=FFF5EB,FEE6CE,FDAE6B,F16913,D94801,A63603,7F2704";

  var chartDataLabels = new Array();
  var chartData = new Array();


Narrative Text:

  chartDataLabels.push('@1');
  chartData.push(@2);


Postfix Text:


  // putting it all together
  chartURL = chartURL + chartBGColor + chartPalette + "&chld=" + chartDataLabels.toString().replace(/,/g,'') + "&chd=t:" + chartData.toString();
  // now get the image from Google Chart
  document.getElementById('GD_mapImg').src = chartURL;
</script>


Check the box “Contains HTML Markup”. Remember this is required.


That’s it, you should see the map in the results section -


To customize the map, see here for more information


Limitations of Google Chart:
* Not interactive: it is just a static PNG image.
* Lack of Legend: especially no legend for Maps.
* Small chart size: largest Map is 440x220

Overall, this simple heat map works well and satisfies most of our current requirements. If you are looking for interactive and more eye-catching maps or charts in general, please be on the look-out for the second part of this series where we will show the same Narrative view approach with a slightly different API.  Spoiler alert: it is another great product from Google.

Friday, November 13, 2009

Utilizing EBS Responsibilities for OBIEE Authorization

As you may already know, the GROUP session variable in the OBI repository can be utilized to store group information brought in from external sources. The repository will assign users to local repository groups when the external and internal group names match.

For instance, if we had an EBS user with a responsibility of 'OBI Admin', we could read that information from EBS and store it in our local GROUP variable. We could then create a repository group with the same name, 'OBI Admin', and assign appropriate permissions to the group. The user would then automatically be assigned to the local 'OBI Admin' group and inherit all permissions within that group. The following diagram depicts this process flow:


The issue here is the GROUP variable is parsed in a certain manner and has specific requirements in order to work correctly. Namely, each group stored in the GROUP variable must reside in the same field and must be separated by a semi-colon. Therefore, row-wise initialization does not work for this process.

So, armed with the above information, we are able to create some custom SQL in the repository that will read all of the responsibilities from the EBS tables for the authenticated user and then roll them up into one field with each group name separated by a semi-colon.

Development Process:
  1. Create a new Session Initializaton Block in the RPD. Name it something like 'getEBSGroups'.
  2. Edit the Data Source for the initialization block to point to your EBS source.
  3. Input the following SQL statement into the Default Initialization String block:


  4. Create two Data Target Variables. The first is used to store the user name and the second is used to store the group information. You may call the first 'EBS_Username'. Make sure you name the second variable 'GROUP'.
  5. Because you are authenticating against OID (LDAP), you should already have an initialization block for authentication purposes. You will need to ensure you edit your execution precedence to run the authentication initialization block prior to attempting to run this block.
  6. Also ensure the user variable you utilized in your authentication initialization block is specified correctly in the following portion of the custom SQL:user_name=upper('valueof(NQ_SESSION.USER)')
  7. Create repository groups that exactly match the names of the EBS responsibilities you are reading in and storing in the 'GROUP' variable.

Upon successful authentication into OBIEE, this new initialization block will kick off and query the EBS tables for the responsibilities of the authenticated user. It will store all of the user's EBS responsibilities in the GROUP variable. The GROUP variable will be parsed by the BI server and any responsibility in the variable that matches an existing repository group will result in the authenticated user being automatically assigned to that repository group!

Friday, October 30, 2009

Business Objects XI R2 and Google Maps

Have you ever felt the need for more visualization techniques than WebIntelligence delivers out of the box? One example is mapping and this is where Business Objects Masher comes in. By installing the Business Objects Masher server, you now have a way to access APIs, such as Google Maps or Flash, and easily incorporate them into a WebIntelligence document. The following diagram shows how mapping integrates into the Business Objects architecture.


The Masher tool comes with two components:

1) Mashup Editor - converts a WebIntelligence report into a Mashup report
2) Template Editor - contains the instructions for how WebIntelligence will convert to the Mashup report you choose

The Template Editor, as shown below, contains several definitions that need to be set for a new template.


Mashup Template Editor: Google Map

In the example of the Google Map, the Requirements needed (parameters passed by the WebIntelligence report) are an address, state, and zip code. These dimensions can be plotted on the X axis while the measures are plotted on the Y. Additional JavaScript coding can be done in the Masher functions of Init, Mash, and Dispose, to perform functions such as creating the markers with specific values, sending the Google API key, and adding in controls like Zoom, Traffic, and Search.

In the example below using the Mash function, these additional controls will be updated any time the WebIntelligence report is refreshed or if the filters are updated.

map.enableScrollWheelZoom();
map.enableContinuousZoom();
var trafficOptions = {incidents:true};
trafficInfo = new GTrafficOverlay(trafficOptions);
map.addOverlay(trafficInfo);
map.addControl(new TrafficControl());
map.addControl(new GLargeMapControl3D());
map.enableGoogleBar();
Additional Controls defined in Mash

After creating a WebIntelligence report with the dimensions and measures needed for the mapping template, you can convert the report to a Mashup report by using the Mashup Editor as seen below. Open the WebIntelligence report, right click on the table, choose “Turn to Table”, and pick the new Google Map format. Then format the Chart to define your parameters for the X and Y axis as defined in the template.


Mashup Editor


Format Chart
 

After saving your report in the Mashup Editor, you can log into WebIntelligence and view your report as you would any other. Our example map can be seen below:


Example Map

Friday, October 16, 2009

OBIEE: Enabling Multi-User Development

Thanks to Venkatakrishnan J for a large portion of the content for this entry. His original entry was published on March 27, 2008.

Enabling Multi-User Development (MUD) to work with the pre-built out of the box repository is the same process as if you are working with a custom built rpd. Typically one implements this solution when there are many data sources and lots of tables; it would make sense to distribute the repository development work to multiple users. In our example we will introduce MUD as a basic feature because we will have many developers between multiple project iterations. The MUD solution is a feature of the OBI EE admin tool wherein multiple users can work on the repository at the same time. The concept of Repository Merging was actually introduced in the product in order to facilitate MUD.

Let’s start with a simple diagram from Oracle below.


The above diagram illustrates how the MUD works. To implement the solution we need to follow the pre-requisites

  1. A shared drive to host the Master Repository
  2. All developer workstations should have access to the master repository.
  3. All developer workstations must have the admin tool installed.

For the MUD to work, the repository that is shared by developers should be kept in a shared directory (Samba share if on Linux). The shared directory should be accessible by each member of the development team. In each of the client’s Admin tool, enter the Shared Directory path.

Now, open the Master repository in offline mode. In MUD each object in the repository will be organized into Projects. So, from within the Admin tool navigate to Manage - Projects.


This will open up a project window. Projects are basically subsets of objects within the Admin tool that can be assigned each developer. The idea being that each developer has his/her own objects assigned to different projects to work on. Typically, each of these projects contains one or more Logical Fact tables from the BMM. As soon as a logical fact table is included all the other dependent objects would automatically be part of the project. It is recommended that one import all the physical tables and create the physical joins in the repository first before implementing MUD. Since we are using the pre-built Financial and Procurement Analytics we don’t have to worry about this. Good news is we can assign Users, Init Blocks and Variables to a project.


After creating and assigning objects to a project, the next step is to save the master repository in a shared drive. Now, open up the Admin tool and navigate to File - Multiuser - Checkout. This Check out process does 2 things

  1. Copies the Master repository from the shared drive to the local drive (This will serve as the developer’s local master repository).
  2. Allows you to choose the project that you have the authority to work on.
  3. Creates a subset repository which contains only the selected project related objects for that developer.
For our example the idea is to work on the subset repository (like creating Financials – GL, Procurement) and then after developer completes their unit tests merge the changes back to the local master repository. The merge process will lock the master repository in the shared drive until it’s complete and then release the lock by selecting “Publish to Network” which will copy the modified and merged local master repository to the shared drive. The process would be the same for the other developers.

Friday, October 2, 2009

Enabling BI Publisher with OBIEE for External Web Users

A challenging task in implementing an OBIEE environment can be the hosting and accessing the BI publisher reports outside of a DMZ or by the general public. Enabling OBIEE using the presentation server plug-in is fairly well documented in Oracle’s install documentation as well as various blogs on the web. Once you have created a website in IIS and followed the steps your installation should look something like this:


With a virtual directory called Analytics that is pointed to the \OracleBI\web\app folder. The application it runs is the saw.dll file. The virtual directory execute permissions property should be set to "Scripts and Executables". The next step is to make sure the Siebel Analytics Web Service Extension (saw.dll) is added as an extension and marked as Allowed.


If you plan on exposing OBIEE and BI Publisher reports to external web users outside the corporate firewall you need to plan for requesting that the correct ports are opened between the Presentation Server and the IIS server and the BI Publisher Server and the IIS server. The default configuration is to open port 9710 for OBIEE and port 9704 for BI Publisher. In the diagram Presentation Server and BIP are on the same internal box. On the IIS server you need to configure the \OracleBIData\web\config\ isapiconfig.xml file with the Internal Server and the port 9710.


Example:


Also you need to configure the \OracleBI\web\app\WEB-INF\web.xml with the internal presentation server and port 9710.


Following the above steps you should have OBIEE working just fine over the internet hosted by IIS. But if you have any BI Publisher reports they will not be available. So to over-come this limitation we need to follow the instructions outlined in section 9.2 of Oracle® Business Intelligence New Features Guide

The Oracle BI Publisher component of the OBIEE installation require Oracle Containers for Java (OC4J) and will not run natively on Microsoft's Internet Information Server (IIS).IIS can be configured as a listener for OC4J. This is accomplished via an IIS proxy plug-in that is provided with the BI EE installation files. When configured, the requests are routed from IIS to OC4J so that it appears to the user that everything is being executed by IIS. Below are the configuration steps:


  1. From your BI EE install files, locate oracle_proxy.dll. The navigation path is as follows:
    \Server\Oracle_Business_Intelligence\oc4jproxy\oracle_proxy.dll

  2. Create a folder on an accessible drive, for example: c:\proxy. Copy oracle_proxy.dll to this folder.

  3. In the same folder, create a configuration file called "proxy.conf " . Following is a sample configuration file:

      1. # Server names that the proxy plug-in will recognize.
        oproxy.serverlist=Internal

      2. # Hostname to use when communicating with
        a specific server.
        oproxy.Internal.hostname=internalserver.company.com

      3. # Port to use when communicating with a specific server.
        oproxy.Internal.port=9704

      4. # Description of URL(s) that will be
        redirected to this server.
        oproxy.Internal.urlrule=/xmlpserver
        oproxy.Internal.urlrule=/xmlpserver/*

      5. When you complete this Step, there will be two files (oracle_proxy.dll and proxy.conf) in the folder that you created in Step 2.

  4. Define the OracleAS Proxy Plug-in Registry as follows:

      1. Edit your registry to create a new registry key named: HKEY_LOCAL_MACHINE\SOFTWARE\Oracle\IIS Proxy Adapter.


      2. Specify the exact location of your configuration file with the name server_defs, and a value pointing to the location of your configuration file, for example: c:\proxy\proxy.conf.

      3. (Optional) Specify a log_file and log_level: Add a string value with the name log_file, and the desired location of the log file, for example, c:\proxy\plugin.log. Add a string value with the name log_level, and a value for the desired log level. Valid values are "debug", "inform", "error", and "emerg".

  5. Create the "oproxy" virtual directory in IIS as follows:

      1. Using the IIS management console, add a new virtual directory to your IIS Web site with the same physical path as that of oracle_proxy.dll. Name the directory "oproxy" and give it execute access.


      2. Using the IIS management console, add oracle_proxy.dll as a filter in your IIS Web site. The name of the filter should be "oproxy" and its executable must point to the directory that contains oracle_proxy.dll, for example, c:\proxy\oracle_proxy.dll.

      3. Add Oproxy as a Web service extension for c:\proxy\oracle_proxy.dll and set status to allow.


      4. Restart IIS (stop and then start the IIS server), ensuring that the filter is marked with a green arrow pointing up.

  6. Check the following configuration files to remove the port 9704 because now IIS is routing all the calls to OC4J.
    \oracleBIData\web\Config\instanceconfig.xml\oracleBI\xmlp\Admin\configutation\xmlp-server-config.xml

  7. To access BI Servlets from the IIS / OracleAS Proxy Plug-in, you must specify the complete URL for example:
    http:///xmlpserver/login.jsp


Friday, September 18, 2009

Value Add: You just need three letters: WHY?

As “experts” in the field of business intelligence, we are called upon day in and day out to help customers find ways to use the data they capture to help solve problems, find opportunities, and to add value to their companies. However, too many times in the process of understanding the customer, the approach taken is to figure out what they do now and make it better. While finding more efficient ways of doing business does add value to the customer, it’s only the tip of the iceberg. By incorporating three little letters, W-H-Y, into the process of understanding our customer, we can often find numerous other ways to help them be successful.

The Pitfalls of Traditional Requirements Gathering:

Traditional Requirements gathering often takes the approach of examining what the customer is currently doing. For example:

• What types of reports do you currently run?
• What type of data do you currently use?
• What type of analysis do you currently do?

While these are all relevant questions to ask as part of the process of understanding our customer’s line of business, too many times this is where the discovery process ends. Often we leave out the word “WHY” when we asking the questions. For example, when asking the question, “What types of reports do you currently run?”, the real value in the question comes when you ask why they need to run these reports. Not only does it give you, as the advisor, better insight into what things are important to their business, it also opens doors to other avenues of data or other applications of existing data that may be of use to the customer. Likewise, the more you can get at the root of why the data is important to the customer the more you can come to understand their pain points, and in doing so, become less prone to be seen as a window dresser and more as a problem solver. As simple as it seems on more than one occasion I’ve had the business area say, ‘it’s really refreshing to feel like someone is taking the opportunity to truly understand our business and help us figure out ways to make it better.’ The amazing thing is that to this point, all you’ve really done is asked questions and listened to what they had to say, and you’ve established yourself in a position of trust.

Helping the end user community determine how to make it better:

It doesn’t take a variety of independent studies to conclude that including your customers in the solution development process will likely result in a much higher adoption rate. Now, there is a time and place for everything. For example, bringing an end user into a meeting to discuss hardware specifications and communications protocol, will often leave the end user feeling lost and confused. This type of session tends to leave them feeling like they have nothing to bring to the table, and it is typically a waste of their time.

However, bringing an end user into a meeting to discuss report layout and navigation will be time well spent. First of all, they probably didn’t have much of a say in how the currently do things, and giving them a say in how the new system will work is very empowering to them. Not only will the end user feel like they have had a say in the process, but it should also expedite time to market by reducing back and forth between developers and end users at user acceptance testing. Likewise, the process of coming up with those specifications will often lead to other discussions that will result in finding other useful ways to unlock the power of the data they have at their disposal.

Result = BI app that was built by and for the end user

At the end of the day, the end user will be the one that has to live with the system that is built. While we as advisors often take a fair amount of pride in the solutions we craft, 9 times out of 10 we get to walk away from a customer to move onto something new. For the customer though, they are left with something that they will work with day in and day out. The relationships we build with our customers are the foundation for future opportunities, and nothing serves us better than to walk away from a project where the end user is excited about what they’ve help create versus something that’s been dropped in their lap. The more we take to time to realize this, the better we set ourselves up to work with the customer in the future.

In summary, it’s not enough as an advisor to survey what’s already in place for a customer and figure out a way to make it look better or run faster. The real value we add is when we help them uncover unique new ways of harnessing the power of their data. Taking the time to understand the customer’s business and how they go about managing the success of that business goes a long way in helping us make those types of discoveries. Taking that information and involving the end users in the development of the solution help cement the value of the work that is being done. It all results in a BI application that is built by and for the customer. Let’s face it, that’s the end game we should all be playing for. At the end of a project, if all you wind up doing is making the same reports run faster or with a different wrapper, at the end of the day your customers may be the ones saying WHY???

Wednesday, September 2, 2009

Cleansing Essential Data, In a Hurry

Recently, a Guident team completed a data cleansing effort that helped a large federal agency centralize data for a new Business Intelligence system. The team took data from dozens of agency sources and put it through a systematic process of cleansing and matching to produce a consistent data set of the millions of companies that interact with the agency daily.

The Problem

The new BI system for Guident’s agency client was designed to show different activities for each company the various agency departments deal with, including inspections, permits, adverse events, infractions, etc., all of which could come from dozens of different sources, in varying formats. All of this data was centralized and shown to personnel from all the different departments, allowing them to coordinate their activities, and to assign resources much more efficiently, since there was a limited number of agency personnel and millions of companies.

In order for the system to work, the name and location of each company needed to be consistent throughout the agency, and each activity, regardless of which department it originated from, would need to be properly associated to the correct cleansed company information.

Oh, and of course, time was limited because the new BI system was to go into User Acceptance Testing in 3 months for a scheduled spring launch.


Dirty Data

You’ve seen the situation before: different departments of an organization capture the same information in different ways. Some departments allow for free form data entry, which means the name of a company may be written as “IBM” or “I.B.M.” or “International Business Machines” or even “Int’l Biz Mach” – and those are the versions without misspellings. Some departments allow selection from dropdown lists, but those lists may not be complete enough forcing personnel to make judgments about just which location to select. Other departments use codes to stand for the real data – but the hidden data may not have been updated in a while.
After checking the many source databases, team analysts found themselves asking: just how many different versions of the word “Corporation” are there?

Cleansing and Matching

Company information was gathered primarily through each activity record. For example: an inspection had the name and address of the company facility inspected, primary contact information, the date of the inspection, the results of the inspection, any associated infraction information, the inspector’s information, etc. The team’s plan involved a two phase cleansing and matching method:

  1. All company information from new activities was first matched against an existing table of unique company names, TB_CENTRAL.
      1. To determine a match, the company facility name and address information was “standardized” – each word went through a function that converted it into a standard format. For example: if four separate records had “Ave.”, “avenue”, “Av”, and “AVN”, they would all be standardized as “AVE”. The full standardized company information would then be compared to the existing standardized company information already existing in TB_CENTRAL.
      2. If a match was found, then that new activity would be associated with the existing matched company.
      3. If no match was found, then the company information for the new activity was added to TB_CENTRAL, and the new TB_CENTRAL record received a code of AWAITING_CLEANSING.
  2. All records in TB_CENTRAL with the code of AWAITING_CLEANSING were sent to an outside data matching and cleansing service (such as Dun & Bradstreet or Lexis Nexis), which would return the records with the best match they could find.
      1. Each returned company facility record went through step 1a and 1b again.
      2. Companies that failed out of 1a and 1b were added as new cleansed records into TB_CENTRAL.


Figure 1: Centralized company information cleansing process

Great Results…and Lingering Issues

This method of data cleansing was very effective, producing a huge company cleansed data center that handled an initial batch of millions of records, and continued to handle hundreds of new activities on a daily basis. This new data center was so effective that owners of systems other than the BI system want to use it as their official source of company data.

There were, however, two important issues to deal with. First, even with the high record of matches, there were still activities whose company info was just not going to be cleansed. The team had decided that any important missing address information (missing state or zip code) would disqualify that record from the matching process. But the activities that matched those dirty company records were still important to the various departments of the federal agency. The team and the agency client decided that the best way to handle this data quality issue was to deliver report details and statistics to the departmental source owners for handling.

The second issue was that from a testing point of view, data had changed. For example, previously there may have been a list of 3 company facilities all which had different spellings of the same address (“Saint Paul, MN”, “St. Paul, MN”, “Seint Poll, MN”), but with any close scrutiny, anyone would conclude that they were the same address. If record 1 had 5 activities, record 2 had 20 activities, and record 3 had 1 activity, under the new company cleansed data center there would be just one company record with 26 associated activities. This was expected, but it also introduced the need to carefully train the client personnel during User Acceptance Testing to be aware of changes in certain expected results.

But having to explain to your user community why their new system really is better is a good problem.
Tools Involved in this Project
  • Oracle Business Intelligence – agency BI system, reporting.
  • Informatica – ETL from agency department data sources into the company cleansed data center, and data analysis.
  • Oracle 10g – databases, SQL procedures and functions.
  • Erwin – data modeling of the company cleansed data center.


Best Practices for Managing Successful BI Deployments/Implementations

Successful Business Intelligence (BI) deployments demand a sound and flexible implementation methodology. The methodology should blend traditional system development lifecycle techniques with newer and more iterative processes to bring immediate value to customers. Guident's Business Intelligence Guide (BIG) is a proven framework that has stood up hundreds of successful implementations at government and commercial sector clients. The BIG consists of iterative Initiate, Analyze, Design, Develop and Implement phases, braced with the guidance and support of Project and Change Management. Key differentiators of the BIG include allowing requirements to evolve and change, providing quick 120-day wins to demonstrate a working prototype, emphasizing the quality and clarity of metadata construction, and instilling flexible project management principles to deliver the solution.

The BIG has evolved by leveraging best practices and lessons learned from past client successes. Having the right mix of processes, technologies, and expertise is not enough to ensure a successful implementation. They all must come together under a solid methodology that clearly defines each phase, the specific tasks, deliverables, templates, and guidelines to provide actionable information across enterprise touchpoints.

Learn more about Guident's BIG and its application at federal and commercial sector clients in this presentation. It was presented at several key BI events including:
  • Oracle COLLABORATE Conference ('08)
  • Business Objects Insight Conference ('06,'07)
  • Oracle BIWA Summit ('07)
  • Oracle OpenWorld ('08)
  • DC Area Business Objects / Crystal User Group ('08).

Crystal Reports 2008 for Web Intelligence XI Users

Crystal Reports 2008 is a powerful feature-rich business intelligence and reporting tool. It allows users to transform data into interactive and actionable information through canned or operational reports. Crystal Reports are flexible enough to access multiple data sources and can integrate with legacy web and Windows applications. The tool is available in three editions to support the demands of the enterprise: a web-based edition for medium-sized organizations that can deliver reports via the web, email, and MS Office format; a desktop installation for dedicated report designers and power users with a drag-and-drop environment; and a version bundled with Xcelsius Engage that allows users to create highly-formatted reports and interactive dashboards.

Crystal Reports 2008 differentiates itself from Business Objects Web Intelligence in that it has built-in wizards that provide step-by-step instructions for report creation, Crystal Reports can directly access multiple data sources, and development can be conducted offline. In addition, Crystal Reports provide a number of out-of-the-box features that allow for more robust reporting. Report designers can export reports in multiple formats including PDF, Excel and Word, create dynamic prompts that allow users to choose report criteria and values, create trigger notifications that alert users when specified conditions are met, and display a wide variety of charts and graphs. Learn more about Crystal Reports 2008 in this presentation to the DC Area Business Objects / Crystal User Group (’08).

Business Objects XI 3.0: Getting Acquainted

Business Objects XI (BOXI) is an enterprise information management, query, reporting and analysis tool. Release 3.0 on the XI platform comes with new out-of-the-box features and enhancements that improve the capabilities of previous releases. Key new features include the ability to track changes between report refreshes, Web Intelligence support for stored procedures in universes, migration enhancements when porting reports from Desktop Intelligence to Web Intelligence, and new BI Widgets that provide personalized information on users’ desktops.

User demands for a more robust Web Intelligence tool have also been addressed with a new rich client. The Web Intelligence Rich Client now allows users to develop and format reports, drill down and slice and dice information online and off. It bridges the functionality gap between Desktop Intelligence and Web Intelligence while improving overall performance. In addition, 3.0 offers a much improved Central Management Console (CMC) for administration. BOXI administrators can more easily navigate through CMC’s menu structure with its enhanced interface, and perform more streamlined tasks through new modal dialog windows. Get better acquainted with Business Objects XI 3.0 with this presentation to the DC Area Business Objects / Crystal User Group (’08).

OBIEE – Custom vs. Pre-Packaged

Oracle Business Intelligence (OBIEE) is a suite of powerful and highly integrated business intelligence tools for enterprise-wide reporting and analytics. Prebuilt components include:

  • Answers - Oracle BI’s ad-hoc query and analysis tool that allows users to create reports, charts and pivot tables
  • Dashboards – interactive homepages with personalized reports, charts and graphics for enhanced decision-making
  • Delivers – a monitoring tool that promptly alerts users of specified business activity via Dashboards
  • In addition, Oracle offers add-on applications and modules to extend OBIEE’s capabilities to key organizational departments. Oracle BI Analytical Applications include Sales, Service & Contact Center, Marketing, Order Management & Fulfillment, Supply Chain, Financials, and Human Resources.


Deploying the OBIEE suite and applications require a prudent strategy with the organization’s business intelligence goals in mind. Three deployment strategies include:

  1. Customizing the OBIEE suite as a standalone product (no additional applications installed)
  2. Implementing the full suite of packaged applications
  3. A hybrid approach with custom development and configuration of pre-built components.

Each deployment path has its pros and cons. Customization should be chosen when business requirements are unique and add-on applications cannot support these needs. This creates a solution that is fine-tuned to the needs of the business but also requires the most time to develop. On the other hand, utilizing the pre-built OBIEE applications and components is typically shorter to turn around and also leverages out-of-the-box metadata and data warehousing content. This strategy works best when the organization is a COTS shop using products from Siebel, Peoplesoft, or SAP since only the configuration of OBIEE is required. Finally, the hybrid strategy allows organizations to address standard and unique business requirements by blending the customization and configuration of the OBIEE suite and applications.


In order to fully realize the investment of an OBIEE implementation, organizations should weigh their business requirements against the suite’s out-of-the box capabilities. For more tips on whether a custom or pre-built OBIEE solution is right for your organization, see this Guident presentation conducted at Oracle OpenWorld (’08).