The Google Chart API allows you to dynamically generate your graphs by simply passing the parameters to an URL and in turn, Google Chart will respond with a PNG-image of your chart. You can then embed this image in tag anywhere in a webpage. For more information on the Chart API see here.
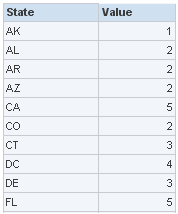
In this illustration, we will create a heat map using US map and data from one of our OBIEE Answers request. Here is the table:
(first column contains US state abbreviations and the second is just a random number from 1 to 6)
Now insert a Narrative view and writing the following codes to its corresponding sections:
Prefix section:
<!--first show a dummy map-->
<img src="http://chart.apis.google.com/chart?cht=t&chm=usa&chs=440x220" id="GD_mapImg"/>
<script type="text/javascript">
// setting up parameters
var chartURL = "http://chart.apis.google.com/chart?cht=t&chtm=usa&chs=440x220&chds=1,6";
var chartBGColor = "&chf=bg,s,EAF7FE";
//specify the gradient: <default color>, <start of gradient>,.., <end of gradient>
var chartPalette = "&chco=FFF5EB,FEE6CE,FDAE6B,F16913,D94801,A63603,7F2704";
var chartDataLabels = new Array();
var chartData = new Array();
Narrative Text:
chartDataLabels.push('@1');
chartData.push(@2);
Postfix Text:
// putting it all together
chartURL = chartURL + chartBGColor + chartPalette + "&chld=" + chartDataLabels.toString().replace(/,/g,'') + "&chd=t:" + chartData.toString();
// now get the image from Google Chart
document.getElementById('GD_mapImg').src = chartURL;
</script>
Check the box “Contains HTML Markup”. Remember this is required.
That’s it, you should see the map in the results section -
To customize the map, see here for more information
Limitations of Google Chart:
* Not interactive: it is just a static PNG image.
* Lack of Legend: especially no legend for Maps.
* Small chart size: largest Map is 440x220
Overall, this simple heat map works well and satisfies most of our current requirements. If you are looking for interactive and more eye-catching maps or charts in general, please be on the look-out for the second part of this series where we will show the same Narrative view approach with a slightly different API. Spoiler alert: it is another great product from Google.


No comments:
Post a Comment