Showing posts with label Data Architecture. Show all posts

Thursday, December 2, 2010

Modeling Multiple Helper Tables in OBIEE

Problem: Dimensional modeling is the preferred method of organizing data in OBIEE but at times the standard configuration for a dimensional star does not represent the way data is collected in the source system.

Traditionally, a star schema has a single fact table with many dimensions. The dimensions are related to many fact records in a one-to-many relationship to the fact. However, sometimes the relationship of the data is many-to-many. An example for this comes from the healthcare industry where one doctor visit record can be associated with multiple diagnosis codes.


We encountered such relationships at a recent project. One of the source systems at this client captured incident data. A traditional star schema did not meet our client’s requirements because this source system collected key measures at an incident grain but there was a need to analyze these measures at a grain below the level at which they were created. The incident data was organized into a six level hierarchy, each of which with a one-to-many relationship to the level below. All the important KPI’s were captured at the incident level. As can be seen in the hierarchy diagram below, an incident is the summary level (top level) of data collected.
We had to create reports at a detail level called “cause of incident” for damages or injuries captured in aggregate at the incident level. The challenge was to attribute all damages in an incident to each cause without double counting damages or injures at the grain being reported.

First, we created Incident, Shipper, Product, Container, and Cause dimensions. Next we created an incident fact table that held all appropriate measures. We then created bridge-tables for each dimension with a many-to-many relationship.
Unfortunately, bridge-tables require a weighting factor. Since the measures existed in the source system only at the summary level, the weighting factor would not correctly attribute fatalities to each detail level item. For example, an incident with 2 fatalities occurred. The incident was attributed to have been caused by an accident and fire. When counting the number of deaths because of fire the business rule is to count 2 for fire not 1 as a weighting factor of .5 would do.

So we decided to trick OBIEE. The picture below shows the central fact with many helper tables that are 1:M from the fact.


However, by leaving the join as a 1:M OBIEE treats the helpers as separate facts. The performance is awful and it does not aggregate correctly. So we changed the relationship to 1:1 and it worked. Because it is an inner join the SQL sent to the database returns the correct number of rows and OBIEE still think the fact is a fact.
The downside is that grand totaling does not work correctly, which did not cause a problem for our requirements, though. If your client’s business rule is to attribute summary level measures equally across the details then a bridge table will work with the appropriate weights. If you need to have multiple many-to-many details using un-weighted summary level measures this solution will work. In summary, this method may not work for every project but for some business requirements it will make a challenging scenario work.

Please contact us if you have any questions.

Friday, October 8, 2010

Best Practices for Maintaining a Data Dictionary

Maintaining an up-to-date Data Dictionary is an important but often neglected task of data modelers. The most critical success factor for maintaining an up-to-date Data Dictionary is the ability to associate data elements to their corresponding business description within the data modeling tool itself. We will demonstrate how this can easily be accomplished with Computer Associate’s ERwin Data Modeler.

Step 1: Open your data model in CA ERwin Data Modeler and switch from the Logical view to Physical or Dimensional view. Enter the business description for each column into the corresponding “Comment” column property as shown below.

Step 2: If your target database server supports comments, ERwin can generate comments in the schema DDL script. In order to demonstrate this functionality, we will use ERwin’s Forward Engineer functionality to push our data model to an Oracle 11g database server. Make sure to check the “Comments” check-box under “Other Options” in the Forward Engineer Schema Generation wizard.

Step 3: The comments are now available in the database. The screenshot below shows that the comments are visible in Oracle’s SQL Developer. Thus, the data dictionary and all its business descriptions are now fully integrated into the meta data of the database objects.

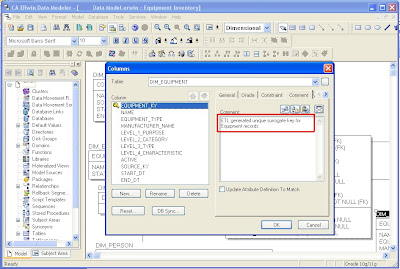
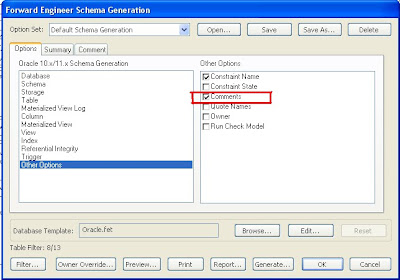
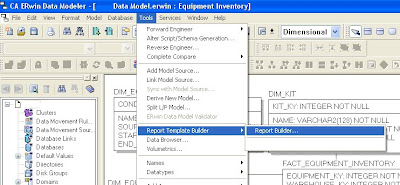
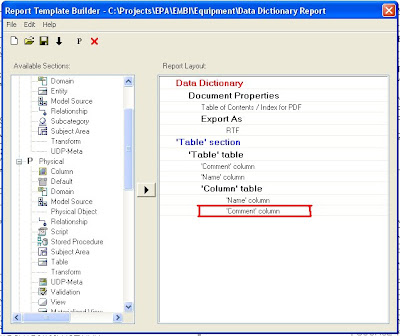
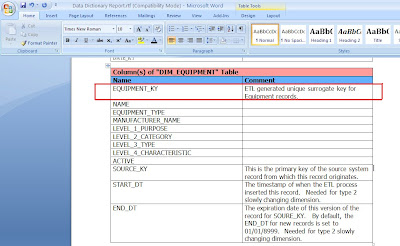
Step 4: Use ERwin’s Report Builder to create a Data Dictionary document. Report Builder queries the ERwin data model to create high quality PDF, Word, XML, or HTML documents that can be used as client deliverables. The screenshots below show the basic steps and a sample RTF output file.


In summary, maintaining the business descriptions for data elements within the data modeling tool has the following advantages:
  • The business descriptions will only have to be maintained in one place (i.e. in the data modeling tool).
  • The data dictionary is fully integrated into the meta data for database objects (if supported by the RDBMS).
  • An official data dictionary document or web page can easily be created by the data modeling tool.

Friday, June 11, 2010

Redundancy in the BI Data Model

Recently, an experienced database professional who had just started his first business intelligence (BI) project asked me two questions:
  1. Is data redundancy allowed in a BI data model?
  2. How much normalization is industry standard in BI if at all?
I had no hesitation answering the first question. Yes, absolutely, data redundancy is not only allowed but is recommended in many situations in BI data models. Redundancy is the key to simple BI data models and fast query response. The rules of normalization, which minimize data redundancy, were designed with transaction processing systems in mind and were also designed at a time when computer resources were scarce and expensive and data storage devices had limited capacity and slow I/O speeds.


One of the primary goals of normalizing to eliminate redundancy was to ensure data consistency. You didn't want to capture the same data at multiple entry points, since this meant extra effort of people typing in what should be the same data but often wasn't because of typos and variations in usage of abbreviations, nicknames, etc. Second, if the data changed and you had redundancy in the data model you had to go back to update multiple records in many tables - not necessarily easy to program and manage. Third normal form data models eliminate these problems and store data efficiently, but not without a price. The proliferation of tables with third normal form means queries have to join many tables. This is no big deal for transaction processing activity because individual transactions only insert or update a handful of rows in each table and typically use procedural code to do this.

With BI data models we don't care about capturing data. That is the job of the source application. So long as the source did a good job of normalizing and capturing the data properly, the BI model does not need to repeat the normalization process to ensure good source data. Second we are not supposed to update records in BI models - data warehouses are supposed to be static. We preserve point-in-time history so we typically don't have to go back and make updates to multiple occurrences of redundant data.

BI queries are very different from source transactions. Having to join many tables in a non-procedural SQL query has a huge cost when you are talking about queries that touch hundreds of thousands or even millions of records which is common for BI. Therefore redundancy that eliminates table joins for runtime queries is a recommended practice in BI. Fewer tables in the model also make it easier for end users to understand the model and easier to write ad hoc queries. Dimensional data modeling featuring the use of star schemas which may include redundancy is the technique most frequently used to reduce the number of tables in the model.

Other examples of acceptable redundancy in BI databases include having the same data stored in staging tables as well as production tables. And having variations of the same data stored in summary tables with different levels of aggregation so standard reports that frequently use the aggregated data run faster.

The answer to the second question is not so easy. There are two diametrically opposed schools of thought on data modeling for data warehousing. The one school, associated with Bill Inmon who is often called the father of data warehousing, believes that data warehouses should first acquire and store all data in non-redundant third normal form. They believe this is still required for good data management practices and do not believe that dimensional data models are robust enough for large data warehouses. However since BI tools like Business Objects and MicroStrategy run best with dimensional models, once the data is safely stored in a third normal form warehouse the model is extended with redundant downstream dimensional data marts that re-extract and reload data out of the data warehouse model into the data mart models.

The other school of thought, associated with Ralph Kimball who is one of the pioneers of dimensional data modeling, believes that dimensional models are perfectly capable of managing data of any size and complexity and are suitable for data warehouses or data marts no matter their size. Followers of this school avoid the extra effort of designing and maintaining two models (one third normal and one downstream dimensional) and two ETL jobs to load the two models. Consequently they also typically deliver new BI projects with shorter development cycles.

Wednesday, January 27, 2010

Data Architecture Guidelines

Any enterprise or business thrives on data. They create, share, and manage data to run their business.

The data architecture describes how the data is created, processed, stored, distributed and managed by a business and or its applications. In other words, it should define an end-to-end vision as how the data flows from source to target to users. A documented understanding of the enterprise data architecture is an essential pre-requisite to many common IS and business improvement initiatives.

The data architecture has many uses. It helps to get a handle on data as it is really used by the business, and it is a key artifact if one wants to develop and implement governance supporting a data strategy. It also helps to guide cross-system developments such as Enterprise Application Integration (EAI), common reporting, and data warehousing initiatives.

The data architecture is never complete, and hence care should be taken when developing the framework such that it is scalable and flexible.

Following are the key stages or phases of a good data architecture:
  • Organize
  • Move
  • Store
  • Access
  • Present
  • Organize


Ensure you identify the source for data collection. It is important to actually identify the source systems, breakdown the data into atomic level so that it can be used or integrated to make it meaningful. Consider reworking or reformatting the original data to the future state as required by business. This effort is time consuming depending upon the original data and the new requirement.

Develop a data model – conceptual, logical and physical that identifies existing and new entities, attributes, and relationships. Define metadata and data dictionary.

Move

Identify the method and technology to move data from source to the new target. This involves choosing a tool that will carry out Extraction, Transformation and Load. Develop business rules and a frame work to integrate data. The frame work needs to consider error handling as well. Develop process and methodology to ensure validity of data that is moved to the target.

Store

Identify a database platform that meets business and technology criteria. Create the database based on the physical model. Ensure the database is sized to accommodate the future growth. Pay special attention to performance – data load, retrieve and reporting. Develop a data retention and archival strategy. Develop process to capture data changes and audit the changes.
Develop policies for data management in each business area:


  • What data is stored.
  • Who is responsible for its collection and quality.
  • Who controls it, and who administers it.
  • How long it must be stored, and how it will be disposed of or archived afterwards.
  • Who may have access to it, and how it should be disclosed to others outside the normal user groups.

Access

Identify the platform as to how the data is accessed – web (intranet, extranet), desktop etc. Develop a security model that identifies the users who would be accessing the data and their rights. Take into consideration of firewalls and other security softwares when data is accessed from external.
Develop a semantic layer that separates business users accessing data directly from the database and incorporate some of the reporting metrics and rules.

Present

Select a suitable presentation tool that satisfies the business needs and that meets the technology challenges. Define presentation layer metrics and layout. Develop a strategy to run the reports. When possible, schedule them to minimize the impact of network traffic and load on the database.