Friday, June 24, 2011

DAC Reporting in OBIEE

The purpose of this blog is to show how to consume data in the DAC repository via OBIEE reports.

What is DAC?

Oracle Business Intelligence Data Warehouse Administration Console (Oracle DAC) provides a centralized console for schema management, configuration, administration, loading, and monitoring of the Oracle Business Analytics Warehouse. The Data warehouse Application Console (DAC) is used to create and schedule Informatica ETL workflows. It manages the following data warehouse load processes:
  • Dynamic generation of subject areas and execution plans
  • Dynamic settings for parallelism and load balancing
  • Intelligent task queue engine based on user-defined and computed scores
  • Index management for ETL and query performance
  • Embedded high-performance OTLP change capture techniques
  • Restart from any point of failure
DAC / ETL Statistics
The metadata for ETL is stored in the DAC repository that is composed of approximately 120 tables. These tables store the ETL metadata such as tasks, task steps, execution plan details, connection details, run history, etc.
In this exercise we are only interested in the run history table - W_ETL_DEFN_RUN. This table has the ETL execution details for every Execution plan that was run through DAC (see screenshot below).

We will be walking you through the steps for creating a simple solution that will allow you to analyze the metadata in W_ETL_DEFN_RUN in OBIEE.
RPD
Below is a simple RPD model that is based on the single W_ETL_DEFN_RUN table from the DAC repository.
Reports
Using the subject area (Statistics – ETL) shown above, you can build useful reports to analyze the execution history (for each execution plan type).
1. Current month summary view with duration in minutes & hours.
2. Snapshot of run duration for each month.
Notice the failed steps in orange below.
3. Report showing Error / Status description with number of steps – Total, Failed, and Success.
4. Compare the ETL for large duration (2010 and 2011).
By adding other repository tables into your RPD you will be able to develop more sophisticated reports. You can even have error reports delivered to you with iBots whenever ETL errors occur.

Friday, June 17, 2011

Informatica - Beyond ETL

Informatica has long been one of the business intelligence / data warehouse industry leaders in data integration. Its PowerCenter and PowereExchange products have consistently been positioned in the leader quadrant for data integration by Gartner. However, Informatica is not resting on its laurels. Since 2009 Informatica has gone on an acquisitions rampage buying up best in breed companies with similar data-centric DNA while at the same time continuing to innovate and broaden its base products. The Informatica Platform now enables you to integrate data within the traditional enterprise (Enterprise Data Integration), control data in the clouds (cloud data integration), share data with your partners (B2B Data Exchange), archive data for efficiency and eDiscovery (Application ILM), and deliver data at zero latency (Ultra Messaging). To unlock the business value of all this data, the platform enables you to cleanse and gain trustworthy data (Data quality), to detect and act on operational intelligence (Complex Event Processing) and gain a 360 view of your strategic, authoritative master data assets (Master Data Management).

Informatica’s CEO stated that “only Informatica delivers the comprehensive, unified and open data integration platform to empower the data-centric enterprise.”


Clearly, Informatica has moved beyond ETL to embrace these key data-centric technologies.

Acquisitions since January 2009:
  • Applimation (Jan. 2009) – Leader in Application Information Life Cycle Management. Helping Customers manage their data assets from cradle-to-grave:

  • Data Archive for storing inactive and rarely accessed data on lower cost storage medium.
  • Data Privacy for masking identifying and identity data to remain in compliance with today’s stringent personal information and privacy laws.
  • Data Subset for creating purpose-built data sets for environment (DEV/QA/SYSTEM) or functional (CRM/ERP/FINANCE/HR) based testing.
  • Address Doctor (Mid-2009) – Leader in Worldwide Name and Address Validation for Over 200 Countries. Providing Customers with the highest quality name and address content for name and address standardization and validation.
  • Agent Logic (Oct. 2009) – Leader in Complex Event Processing and Operational Intelligence. Helping Customers institutionalize event detection patterns and human analysis patterns into automated opportunistic action and response alerts.
  • Siperian (Jan. 2010) – Leader in Master Data Management. Helping Customers achieve mastery of a single view of ‘X’ across all mission critical data domains.

Wednesday, June 8, 2011

Data Modeling: Schema Generation Issue with ERwin Data Modeler 7.3

We are using Computer Associate's ERwin Data Modeler 7.3 for data modeling. In one of our engagements, we are pushing data model changes to the physical database (Oracle 11g R2) via ERwin's Forward Engineering / Schema Generation functionality.


The Forward Engineer / Schema Generation wizard offers the "Physical Order" option under "Column". Checking this box is supposed to force the ERwin DDL generation engine to preserve the column order (i.e. the column order in the physical database must match the column order in the logical/physical model).

Problem: Even though our data modelers pay very close attention to the column order in the logical and physical model in ERwin, the Forward Engineering / Schema Generation process seems to lose the physical column order when generating the DDL (even though the "Physical Order" option is checked). Thus, the column order in the Oracle database never matches with the column order in the ERwin data model.

Solution / Work-Around: This is a bug as the behavior of this option seems to be inverted. If you want to preserve the column order, the "Physical Order" must be un-checked.

Friday, June 3, 2011

Upgrading to Informatica PowerCenter 9.1 from Version 8.6

We have completed the upgrade from Informatica PowerCenter 8.6 to PowerCenter 9.1. The Informatica Upgrade Guide for PowerCenter 8.5.x and 8.6.x describes an in-place upgrade of an existing hardware and software environment. However, as we wanted to upgrade our hardware at the same time, our plan was to setup a brand new Informatica PowerCenter 9.1 environment and import the code from our legacy PowerCenter 8.6 server.

Installing Informatica PowerCenter 9.1 on a Windows 64-bit server was straight forward but we ran into the following two issues:
  1. There seems to be a bug in the Pre-Installation System Check Tool (i9Pi). The purpose of this tool is to check that the server meets all installation requirements. This tool kept raising the following error “Make sure that open cursors are at least set to 1000” for our repository connection information to our Oracle 11g database. Even after our DBA had set this value to 1500 and restarted the Oracle 11g database service, the Pre-Installation System Check Tool continued to raise this error. This seems to be a bug in i9Pi because the installation was able to complete successfully.
  2. If you are planning on running Informatica PowerCenter 9.1 on a Windows platform, please be aware that Informatica has released an Advisory for Windows 32-bit Server and 64-bit Server Platforms. Informatica has identified problematic behavior of the PowerCenter Server, which a user would observe when monitoring multiple concurrent tasks from PowerCenter Workflow Monitor. This behavior is tracked as CR 252994 within Informatica’s bug tracking system. Informatica has released an emergency fix that can be downloaded at the following location:
After installing Informatica PowerCenter 9.1 and starting the service, one has to log into the Administration console (http://server-name:6008) and create the Repository Service and the Integration Service. Once done, install the Informatica PowerCenter 9.1 Client on a client workstation and re-create all Connection information in Workflow Manager. This is a critical task because dependent objects cannot be validated during import without having all corresponding source and target connections defined.

Export all Informatica content from the legacy 8.6 environment into an XML file and import it into the Informatica PowerCenter 9.1 environment with Workflow Manager (Repository ==> Import Objects). After this, we were able to run the imported code in version 9.1 without problems.
Please let us know about your experiences with upgrading to PowerCenter 9.1.

Friday, May 27, 2011

How-To: Creating a Universe with the BO XI 4.0 Information Design Tool

The following describes the steps to create a universe with SAP BusinessObjects XI 4.0's new Information Design Tool.


We would like to start with a graphic displaying a systematic method to create universes in the new tool.


Figure 1: Universe Creation Flowchart for the Information Design Tool

There are a few new terms that may jump out as you are reading this, but in case you have not noticed them, let's take a minute to list those terms out:

  • Connection – define how a universe connects to a relational or OLAP database. Local connections are stored as .CNX files, and secure connections are stored as .CNS files.
  • Data Foundation – a schema that defines the relevant tables and joins from one or more relational databases. The designer enhances the data foundation with contexts, prompts, calculated columns, and other SQL definitions. The data foundation becomes the basis of one or more business layers.
  • Business Layer – the universe under construction, and when the business layer is complete, it is compiled with the connections or connection shortcuts and data foundation, published, and deployed as a universe.
  • Universe – the compiled file that includes all resources used in the definition of the metadata objects built in the design of the business layer.

Each of the items above refers to a resource that can be stored in a Project when developing in the Information Design Tool. A project is a named local workspace that contains one or more resources used to build universes. Projects can be shared so that multiple designers are able to work on the same resources.

Step 1: Open the Information Design Tool. The new interface screen will be displayed.

NOTE – All created resources will be labeled as "TestProject[resourceType]", i.e. "TestProjectConn" for Test Project Connection.


Figure 2: New Interface Screen

Step 2: Create a new Project by clicking on File->New->Project.


Figure 3: Create Project Option

A local project must exist to assign resources; otherwise an error message will be given.


Figure 4: Sample Error if no local project exists


Figure 5: New Local Project Created

Step 3: Create a new Connection. Right-click on the project you just created, or use "File->New" and choose the Relational Connection or OLAP Connection.

For the purpose of this entry, we will be creating a Relational Connection.


Figure 6: Choose a Connection


Figure 7: Define a name for Connection

Step 4: Select the proper Database Middleware driver and configure the connection. The tool comes equipped with several DB driver connections with a default installation.

Note – You must have proper privilege to the schema you are accessing. Also, an ODBC or OLE DB connection must already be established to function properly.


Figure 8: Choose the Middleware Driver


Figure 9: Connection Configuration 1


Figure 10: Connection Configuration 2


Figure 11: Connection Configuration 3


Figure 12: New Local Connection Created

A new connection should now be present and expanded in the project. This connection remains local to the project. Connections to be used in published universes will need to be published to the repository and saved as secure connections.

Step 5: Publish the connection to the repository as a secure connection. Right-click on the new local connection, or highlight the connection and choose the "File->Publish->Publish Connection to a Repository" option.


Figure 13: Publish the Connection to a Repository


Figure 14: Secure Connection Shortcut Established

Step 6: Create a new Data Foundation and configure the Data Foundation. Right-click on the project you created, or use the "File->New->Data Foundation" option.


Figure 15: Data Foundation Configuration 1

Note – there are two types of data foundations: Single-Source and Multisource-Enabled.

Single-Source

  • Support a single connection.
  • The connection can be local or secured, which means you can publish universes based on the data foundation either locally or to a repository.
  • Recommended for the following situations: you want to work exclusively with database-specific SQL syntax, or you want to publish the universe locally and work outside of a repository.
Multisource-Enabled

  • Support one or more connections.
  • You can add connections when you create the data foundation and anytime later.
  • Multisource-enabled data foundations only support secured connections, and universes based on this type of data foundation can only be published to a repository.
  • Required for the following situations: you want to insert tables and joins from more than one relational data source, you want to insert tables and joins from more than one relational data source, or you want to use SQL-92 syntax and SAP BusinessObjects SQL functions.


Figure 16: Data Foundation Configuration 2

Step 7: Select the Connection to associate to the Data Foundation.


Figure 17: Data Foundation Configuration 3


Figure 18: Data Foundation Created

Step 8: Choose the Tables to Insert. You also have an option to insert Derived Tables and Views as well.

Note – Joins to objects in the Data Foundation can either be detected or manually inserted.


Figure 19: Insert Tables for Data Foundation 1


Figure 20: Insert Tables for Data Foundation 2


Figure 21: Data Foundation Created

Step 9: Create a Business Layer. Right-click on the project you created, or use the "File->New" and choose the Relational Business Layer or OLAP Business Layer. The type of business layer depends upon the connection that you used for the Data Foundation.


Figure 22: Business Layer Configuration 1

Step 10: Select the Data Foundation that you would like to use as the basis for the business layer. The tool also provides the option to automatically create classes and objects based on the Data Foundation Layer.


Figure 23: Business Layer Configuration 2


Figure 24: Business Layer Created


Step 11: Publish the Universe to the Repository. Right-click the Business Layer and choose the "Publish->To a Repository" option. This will save the Universe as a .UNX file.

Note – Ensure the Connection for the corresponding Data Foundation is a Secure Connection.


Figure 25: Publish Universe 1


Step 12: Execute a Universe Integrity Check and ensure critical errors are resolved.


Figure 26: Publish Universe 2


Step 13: Choose the Repository Folder to store the Universe.


Figure 27: Publish Universe 3


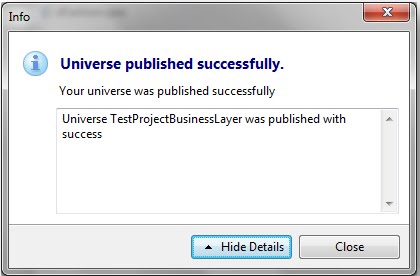
After clicking the "Finish" button, the Universe is successfully published and ready for use by the users.


Figure 28: Universe Published


You can verify that the Universe is available by logging into Interactive Analysis and creating a new document.


Figure 29: Universe Available for use in Interactive Analysis


This concludes the guide to create a Universe using the Information Design Tool. As you can see, some new terminology has been added along with a different approach to create an entire universe. We feel that the new layout and approach is tailored for multiple information designers to work on specific resources. Even though no official statement has been made by SAP BusinessObjects, we believe that the Information Design Tool will become the eventual successor to the Universe Design Tool.

Monday, May 23, 2011

Overview of Business Objects XI 4.0

SAP recently released its Business Objects Enterprise 4.0 Business Intelligence (BI) platform. The new version made updates to enhance both the end user experience and the administration of the application.

End Users
The new home page for Business Objects 4.0 is the BI Launch
pad. Formerly called InfoView, BI Launchpad welcomes users to Business Objects with a home page similar to iGoogle. Widgets displayed on the home page include My Applications, My Recently Viewed Documents, Unread Messages in My Inbox, My Recently Run Documents, and Unread Alerts. A ‘Widget’ is a user interface allowing quick access to data or an application. The BI Launchpad also features tabbed browsing.

When logging in, users have two default tabs, a home tab (previously mentioned) and a documents tab. The Documents tab gives users the old InfoView Folders view featuring Favorites and Inbox. Another advantage of tabbed browsing is the ability to have multiple reports open at once, a feature Business Objects users have wanted for awhile now. Users have the option to pin reports/documents, making them available for quick access each time the user logs into the system. Below is a screenshot of the BI Launchpad.

Another user tool modified for the Business Objects 4.0 release was WebIntelligence. WebIntelligence is also called Interactive Analysis for this release. The best feature added to the WebIntelligence tool is a raw data view available in the query panel. Users simply click a Refresh button when building their query and 15 rows of raw data are presented allowing for a quick analysis of the returned data set sample. See the screenshot below for an example of the Data Preview feature.
This allows the user to modify the query if the expected results are not shown before running a larger report. Other highlights include more chart types with additional chart features, toolbars in ribbon form similar to Office 2007, and greater consistency between the Java and Web Interfaces.
Other user tools updated with the Business Objects 4.0 release include Desktop Intelligence, Xcelsius, Life Office, Voyager, and Explorer. Desktop Intelligence is eliminated from the Business Objects Enterprise package. All Desktop Intelligence reports must be converted to either Crystal Reports or Web Intelligence reports. The report conversion tool can be used before or after the Business Objects 4.0 upgrade is performed. Xcelsius is still available but has been renamed to Dashboard Design. Live Office is incorporated within the release, allowing BI content to be more accessible throughout the Microsoft Office suite. Voyager, Business Objects’ OLAP data analysis tool, has been replaced with Advanced Analysis. Advanced Analysis highlights an enhanced task and layout panel view to improve productivity and depth of analysis for multidimensional data. SAP Business Objects Explorer is a data discovery application that allows users to retrieve answers to business questions from corporate data quickly and directly. Explorer is installed as an add-on to Business Objects Enterprise 4.0, and can be integrated with the BI Launchpad.

Administrators
Administration updates have been made throughout the Business Objects 4.0 Enterprise.
The look and feel of the Central Management Console (CMC) is similar to that of BOXI 3.0, although several features have been updated for greater user administration. Auditing has been updated throughout the release. The CMC Auditing feature allows administrators to modify what is being audited. Monitoring is now available through the CMC. Monitoring allows administrators to verify all components of the system are functioning properly. Response times can be viewed and CMS performance can be evaluated within the Monitoring feature. See the screenshot below for the Monitoring interface.
Universe design received an update in the 4.0 release with a new tool called the Information Design tool. The highlights of the tool include the ability to create multisource universes, dimensional universes that support OLAP dimensions and hierarchies, and easier management of repository resources. Each universe will now consist of three files (or layers), a connection layer, a data foundation, and a business layer. The connection layer defines the connections used for universe development. The data foundation layer defines the schemas being used for a relational universe. The business layer is the universe created based on your data foundation. Resources can be shared, allowing connections and data foundations to help create multiple business layers (or universes). Below is a screenshot showing the Information Design Tool. The upper left shows the project with the different layers created. The bottom left shows the shared repository resources. The right side is similar to previous versions of Business Objects Designer.
Import Wizard has been replaced by two separate tools, the Upgrade Management tool and the Lifecycle Management Console. The Upgrade Management tool allows for direct upgrades from Business Objects XI R2 SP2 or later. The new easy to use interface allows upgrades to go more smoothly. The Lifecycle Management Console is a web-based tool which gives administrators a way to handle version management. Rollback and promotion of objects is available among different platforms if the same version of Business Objects is being used.

Getting to 4.0
Business Objects 4.0 is a complete new install, an upgrade option is not available. To migrate over specific application resources (Universes, CMS data, etc.), older versions of Business Objects (5.x, 6.x) must be upgraded to Business Objects XI R2 or later first. The deployment of 4.0 has also been simplified through the use of a single WAR file for web application deployment. Business Objects servers and web application tier can only be installed and run on 64-bit operating systems.

Friday, April 29, 2011

Parallelization of ETL Workflows

One of the most often overlooked ETL architecture design techniques is to ensure that all available hardware resources, in particular CPUs, are utilized. Consider the sample ETL workflow in the figure below. In this workflow, all ETL tasks are scheduled to be executed in series, i.e. one after another. In general, execution tasks only utilize one CPU (with some exceptions). Thus, executing one task after another would only utilize a single CPU, no matter how many CPUs are available.
Thus, in order to utilize all available CPUs on a server, ETL tasks should be scheduled to execute in parallel. Scheduling a highly parallelized ETL workflow requires some planning as all ETL task dependencies need to be understood first. For example, if DimTable1 and DimTable2 are dimension tables for FactTable1, then DimTable1 and DimTable2 need to be loaded first before FactTable1 can be loaded. In addition, if there are no dependencies between DimTable1 and DimTable2, then we can execute their specific ETL processes in parallel.
The output of this dependency analysis is an ETL Task Execution Order Map, as outlined in the figure below. The ETL Task Execution Order Map will then be the template for the ETL workflow layout. As each task will utilize an available CPU, this approach will be able to utilize multiple (if not all) CPUs and provide better performance.
One word of caution, though: The number of parallel scheduled tasks should not significantly exceed the number of CPUs on your server. If there are many more concurrent tasks than CPUs, then the overhead of the OS scheduler switching jobs in and out of CPU time may actually decrease performance.
To avoid this problem, many ETL tools (such as Informatica Power Center) provide a global setting that limits the number of concurrently processed tasks regardless of how many tasks are scheduled to run in parallel. Let us call this setting N. As a general rule, N should be set to the number of CPU (cores) of the server. In this case, one should schedule as many tasks in parallel as outlined in the ETL Task Execution Order Map. This option is very useful in environments with different number of CPUs in the development, test, and production hardware as we do not have to create workflows based on the underlying hardware constraints. In this case, we just set N in each environment to the respective number of CPUs.