Friday, May 14, 2010
Extensibility of Oracle BI Applications
A critical success factor for successful adaptation of Business Intelligence (BI) in organizations is proven results in a relatively short period of time. To maintain executive buy-in and funding it is often required for BI projects to show results in 90-120 days. For solutions with Oracle E-Business Suite, PeopleSoft or Siebel CRM the choice of using Oracle BI applications is a simple one due to the high degree of match to the data from the source systems. These solutions enable rapid return on investment providing comprehensive BI solutions based on best practices in a much quicker timeframe than what could be delivered through custom development. However, can efficiencies also be achieved when the source system is not closely aligned with the BI application? This paper will introduce the Oracle BI Analytic Applications and discuss the benefits of these pre-built analytics applications for projects that are not sourced from the ERP applications. In this paper, we will also follow an example project that used Public Sector Case Analytics without a Siebel ERP source to reduce time to market in delivery of a data warehouse (DW) and BI solution.
The remaining content of this whitepaper can be found on Oracle's site at:
http://www.oracle.com/us/solutions/ent-performance-bi/guident-extensibility-bi-apps-wp-070085.pdf

Friday, April 30, 2010
BusinessObjects XI - Prompt for Block Type
BusinessObjects Web Intelligence reports can’t prompt the end users to display the data in table or chart on a report using its built-in features. However, this can be achieved by using a sophisticated technique that is demonstrated below.


- Prompt for Table or Chart when refreshing a document
- In Desktop Intelligence, this was easy with “Hide Block”
- But we can make it work in Web Intelligence, too

- We start in Universe Designer, and create a Prompt object
- Disclaimer: This object will not parse, but will work when used with other objects

- Next, we create a query, using the new object

- None of those objects are used in the report
- Create 2 variables for each universe object:
Chart Year: =If(UserResponse("Display Data in
Table or Chart?")="Chart";[Year])
Table Year: =If(UserResponse("Display Data in
Table or Chart?")="Table";[Year])
- Create a table using the “Table” variables
- Create a chart using the “Chart” variables
- Set the Table and Chart to not be shown when empty
- Place the chart on top of the table

The Result:

Tuesday, April 20, 2010
Criteria for Selecting a BI Tool – Thoughts?
Tool selection is an important part of the Business Intelligence implementation process and many software companies have flooded the space in recent years. At Guident, we have implemented hundreds of BI solutions using technologies from many of the industry leading BI software vendors. All of the leading BI software products have very powerful features and Guident believes they can be used successfully when implemented properly. However, it does require a very experienced BI professional to evaluate the differences and determine what factors really impact a given implementation. Guident has our own set of criteria to help our clients with their tool selection, but we’d like to hear from you. Let us know what criteria you are considering or have considered when evaluating a BI tool for your enterprise reporting needs.
Leave us a comment and we will incorporate your criteria and thoughts into a follow-up blog entry. We’ll collect and consolidate your comments into one of the following 6 categories:
When leaving comments, please let us know the criteria you are using to evaluate a tool and the category your criteria fits into.
Leave us a comment and we will incorporate your criteria and thoughts into a follow-up blog entry. We’ll collect and consolidate your comments into one of the following 6 categories:
- Semantic/Metadata layer
- Reports
- Dashboards
- Security
- Advanced Querying and Ad hoc Reporting
- Out of the Box Solutions
When leaving comments, please let us know the criteria you are using to evaluate a tool and the category your criteria fits into.
BusinessObjects XI and OpenLDAP
Supported BOXI authentication methods / plug-ins
BusinessObjects 3.1 supports three modes of user authentication:

It is important to note that attribute mappings must coincide between the LDAP directory and the BusinessObjects Enterprise for the authentication to work properly.
Now let’s review a LDAP structure that maps accordingly with the attributes above. In the example below, attributes are color coded to reflect how the mappings from the LDAP directory correspond to those set within the Central Management Console (CMC) of BusinessObjects:

Adding Dynamic LDAP Groups to The BOE
Once the source LDAP directory is configured properly, the LDAP Configuration Wizard under the Authentication section of CMC is used to configure BOXI. Enter all required information and when prompted to add groups, the full distinguished name (dn) of the dynamic LDAP group(s) must be entered as shown in the screenshot below.


Note: If there is no existing / corresponding Enterprise user account contained within the BOE, select “Create a new account for every added LDAP alias” when prompted for how new LDAP users and aliases are created. However, if Enterprise accounts exist and match exactly to usernames contained within the LDAP directory, select “Assign each added LDAP alias to an account with the same name.”
Managing Dynamic LDAP Groups within CMC
Once LDAP groups are synced with the BOE, they can be managed as with any other group contained in the Enterprise. Simply go to the Groups section in the CMC and set rights as needed. A recommended practice is to instantiate an Enterprise group and set the desired rights on it. Next, make the LDAP group a member of that parent Enterprise group so it inherits its rights. This allows any future LDAP groups to be added as needed, rather than setting rights explicitly on the new group itself.

BusinessObjects 3.1 supports three modes of user authentication:
- Default Enterprise authentication which allows for complete user and security administration within the BusinessObjects Enterprise itself
- Utilization of a LDAP plug-in that allows the BusinessObjects Enterprise (BOE) to add, sync and authenticate users with a 3rd party LDAP directory
- Utilization of a Windows Active Directory (AD) / NT security plug-in to add and map users of an external database with those in the BOE.

It is important to note that attribute mappings must coincide between the LDAP directory and the BusinessObjects Enterprise for the authentication to work properly.
Now let’s review a LDAP structure that maps accordingly with the attributes above. In the example below, attributes are color coded to reflect how the mappings from the LDAP directory correspond to those set within the Central Management Console (CMC) of BusinessObjects:

Adding Dynamic LDAP Groups to The BOE
Once the source LDAP directory is configured properly, the LDAP Configuration Wizard under the Authentication section of CMC is used to configure BOXI. Enter all required information and when prompted to add groups, the full distinguished name (dn) of the dynamic LDAP group(s) must be entered as shown in the screenshot below.


Note: If there is no existing / corresponding Enterprise user account contained within the BOE, select “Create a new account for every added LDAP alias” when prompted for how new LDAP users and aliases are created. However, if Enterprise accounts exist and match exactly to usernames contained within the LDAP directory, select “Assign each added LDAP alias to an account with the same name.”
Managing Dynamic LDAP Groups within CMC
Once LDAP groups are synced with the BOE, they can be managed as with any other group contained in the Enterprise. Simply go to the Groups section in the CMC and set rights as needed. A recommended practice is to instantiate an Enterprise group and set the desired rights on it. Next, make the LDAP group a member of that parent Enterprise group so it inherits its rights. This allows any future LDAP groups to be added as needed, rather than setting rights explicitly on the new group itself.

Wednesday, March 31, 2010
Multiple RPD’s Online Simultaneously on the Same Oracle BI Server
Multiple OBI repository (RPD) files can be placed online simultaneously in a single OBI server so that each of them can be individually accessed through separate BI Presentation services.
- Stop all the OBI Services (i.e. OBI Server, OBI Presentation Server and Java host).
- Open the NQSConfig.ini file and add lines as shown in the screenshot.
- Now start the OBI services (i.e. OBI Server, OBI Presentation Server and Java host). The OBI server will point to the paint RPD as it has been marked as default.
- Now we have to point to the Guident RPD from the Presentation service of another system. For this a DSN has to be created pointing to the BI server where the Guident RPD is residing.
- Go to Control Panel-->Administrative Tools-->Data Sources (ODBC). Go to the System DSN tab and click on Add.
- Create New Data Source window pops up, from the list of drivers displayed select Oracle BI Server and click on Finish.
- The OBI Server DSN Configuration window will open. Enter a Name (TEST_DSN) for the DSN and the IP address of the system containing the OBI Server which is pointing to the Guident RPD and then click on Next.
- In the next window select the checkbox Change the default repository to and enter the name of the RPD as Star1 and click on Next. In the next window click on Finish.
- Now edit the instanceconfig.xml file and go to the DSN tag. Change the DSN from the default AnalyticsWeb to the DSN that has just been created (TEST_DSN).
- Now start the BI Presentation Server and Java host on this machine. It will be pointing to the Guident repository.


Tuesday, March 16, 2010
Data Profiling for Business Intelligence
Early in my career as a business intelligence consultant I was on assignment to a federal agency that produced a report to Congress that showed the impact the agency had in each congressional district. My task on this project was to identify how much money the agency expended with its suppliers in each district. We acquired a set of data from the agency’s purchasing and contracts database, enhanced the data with the addition of congressional district identifiers based on supplier addresses, and produced the requested report. Our celebration on a job well done was cut short when a skeptical congressman from a rural district asked for details on the agency’s $300 million contract with a supplier in his district. It turns out the contract in question was for $30 million and not the $300 million reported. The contract record in the source data set included an extra zero. The agency suffered embarrassment and loss of credibility because the congressmen knew his district well enough to question whether he had a $300 million business in his midst but we didn’t know the agency’s data well enough to flag a $300 million contract as suspicious.
Had we known about and applied data profiling to the contracting data before producing the Congressional impact report we could have avoided the embarrassing incident with the congressman. Just like the coaching staff of a football team scouts an unfamiliar opponent to prepare for a game we could have scouted the unfamiliar data set to prepare a game plan for reporting. Football scouts learn the height and weight of the opponent’s players. They identify the fastest and slowest players. They find out how long each player has been in the league and how long they have been with their current team. They identify the special talents of the team’s star players and review the formations and plays the team uses in different game situations. Armed with this information the coaching staff prepares a strategy and game plan to increase the chances of a successful outcome.
In much the same way as football scouts, practitioners of business intelligence create profiles (see figure below) to learn the characteristics of new and unfamiliar sources of data. They count the number of tables in the database and number of rows in each table. They gather statistics about each column. They find out if numeric columns contain both positive and negative values, whether address tables contain only domestic or also include international addresses, whether phone number columns included international format phone numbers or have extensions embedded after the phone number. They look for missing or incomplete data values, potential data quality problems, and a range of other data conditions to expand their understanding of the data source.
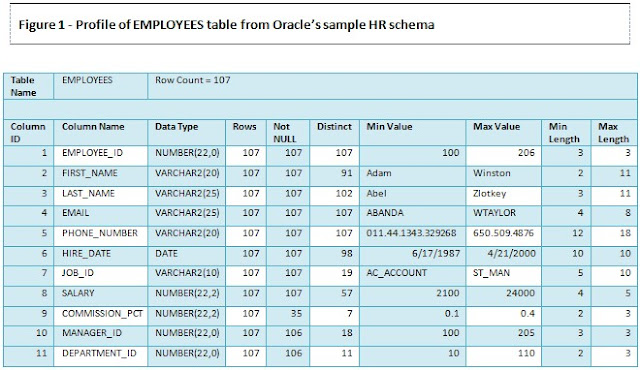
The report above is just the starting point to provide a comprehensive overview of a data set. There are a number of other profiling reports that drill deeper into different details of the data set all with the goal of learning what is and isn’t possible with a data source and how to efficiently and accurately report on the data . The primary purpose is to confirm that the data you plan to work with is in fact what you think it is and that it will support the reporting requirements you intend to use it for. You can’t just look at a data model for a source and assume it has what you need because you see the right table names and column names. You may discover that columns are empty or contain very different data from what you expected based on the column name. Application developers frequently change the usage of columns without modifying table structures or updating documentation and end users are famous for figuring out workarounds that involve putting data into fields that were intended for other purposes. The data profile will reveal the actual usage of data.
From the profile you can also measure transaction volumes over time and identify growth trends – information you need to support capacity planning and disk storage requirements for a data warehouse. The profile reveals peaks and valleys in transaction volume that help to plan maintenance cycles for the data warehouse. And the profile exposes the nature and scope of data quality problems that could derail your project if not properly planned for.
Whether you are doing a one-time reporting project with a one-off data set or setting up a data mart or data warehouse for long-term use, data profiling of the source data is a critical first step that should be completed before anybody delivers reports. Employing data profiling during the early analysis phase of business intelligence and data warehousing projects produces three significant benefits for the sponsoring organization.
Had we known about and applied data profiling to the contracting data before producing the Congressional impact report we could have avoided the embarrassing incident with the congressman. Just like the coaching staff of a football team scouts an unfamiliar opponent to prepare for a game we could have scouted the unfamiliar data set to prepare a game plan for reporting. Football scouts learn the height and weight of the opponent’s players. They identify the fastest and slowest players. They find out how long each player has been in the league and how long they have been with their current team. They identify the special talents of the team’s star players and review the formations and plays the team uses in different game situations. Armed with this information the coaching staff prepares a strategy and game plan to increase the chances of a successful outcome.
In much the same way as football scouts, practitioners of business intelligence create profiles (see figure below) to learn the characteristics of new and unfamiliar sources of data. They count the number of tables in the database and number of rows in each table. They gather statistics about each column. They find out if numeric columns contain both positive and negative values, whether address tables contain only domestic or also include international addresses, whether phone number columns included international format phone numbers or have extensions embedded after the phone number. They look for missing or incomplete data values, potential data quality problems, and a range of other data conditions to expand their understanding of the data source.

The report above is just the starting point to provide a comprehensive overview of a data set. There are a number of other profiling reports that drill deeper into different details of the data set all with the goal of learning what is and isn’t possible with a data source and how to efficiently and accurately report on the data . The primary purpose is to confirm that the data you plan to work with is in fact what you think it is and that it will support the reporting requirements you intend to use it for. You can’t just look at a data model for a source and assume it has what you need because you see the right table names and column names. You may discover that columns are empty or contain very different data from what you expected based on the column name. Application developers frequently change the usage of columns without modifying table structures or updating documentation and end users are famous for figuring out workarounds that involve putting data into fields that were intended for other purposes. The data profile will reveal the actual usage of data.
From the profile you can also measure transaction volumes over time and identify growth trends – information you need to support capacity planning and disk storage requirements for a data warehouse. The profile reveals peaks and valleys in transaction volume that help to plan maintenance cycles for the data warehouse. And the profile exposes the nature and scope of data quality problems that could derail your project if not properly planned for.
Whether you are doing a one-time reporting project with a one-off data set or setting up a data mart or data warehouse for long-term use, data profiling of the source data is a critical first step that should be completed before anybody delivers reports. Employing data profiling during the early analysis phase of business intelligence and data warehousing projects produces three significant benefits for the sponsoring organization.
- Accurate Reporting
- On-time Project Delivery
- High Performance and Availability
Without data profiling, data warehouse data model design choices are educated guesses at best and users are left to make risky assumptions when creating reports. With the benefit of data profiling the structure and labeling of the data warehouse data model and user presentation semantic layer represent the true state and usage of the source data. Data quality problems have been identified, documented, and mitigated. And users who run reports and ad hoc queries have a road map to understand what is and is not reasonable for report results.
All too often the first good look at source data takes place when developers start testing data warehouse load processes. At this stage in a project the discovery that assumptions about data were incorrect or that there are serious data quality issues means that instead of moving forward on schedule developers must reopen closed phases of the project plan to redo data model and load process designs and extend the load process development phase to complete unplanned data quality work. Thorough data profiling during the analysis phase of the project eliminates data surprises that delay the development phase.
No one wants to see databases crash when disk space runs low or wait sessions back up in the queue. And even if the database is up users won’t come back for more and won’t work the data as hard as they can if poor query response times leave them hanging. Using profiling to learn characteristics such as how data values are distributed across rows of data, the relationships between data elements, and the size and growth characteristics of data provides a solid basis to make decisions about storage options, index usage, and data partitioning that maximize query throughput and keep the data warehouse database running smoothly.
Friday, February 19, 2010
Creating an ODI (Oracle Data Integrator) Dashboard with OBIEE
One of our clients needed a simple way to view ETL success and failures statistics in an easy to navigate monitoring tool. The ODI Operator is great for technical users who have ODI installed but can be complex for business users. Operator can also become slow due to the large number of interfaces that run each night. Exposing the ODI work schema to OBIEE was a logical solution to this problem. We used OBIEE as a way to report and graph ODI ETL executions.
It is also worth noting that having good naming conventions can really help with navigating the ETL repository. For example all of our interfaces are prefixed with INF_%, and Packages with PKG_%. We also have naming conventions for loading Staging, Dimensions, and Facts, etc.
Below are the steps to bring ODI ETL statistics into OBIEE
Metadata
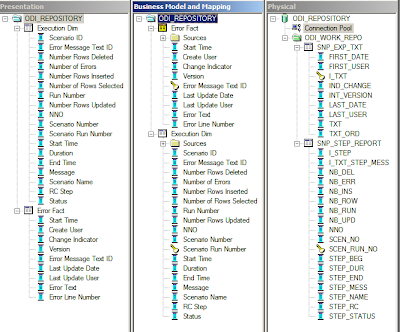
Once the physical schema is brought in you will want to rename the columns to something more meaningful. The only column that needs further definition is the decode statement for STEP_STATUS (Status). These can also be found in the ODI Documentation Substitution Methods Reference.
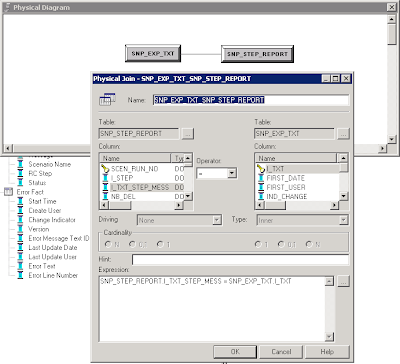
Join SNP_STEP_REPORT and SNP_EXP_TEXT on I_TXT_STEP_MESS = I_TXT. This is the join for the error message text and will display the corresponding error message with the user clicks on the error id.
Dashboard
We created a dashboard for our client with the following elements.

Reports
Past 5 Days Execution Time (in Hours) - High level ETL execution time.

All Executions in Past 24 Hours (with drill-through)

All executions per Interface

Interfaces Error Message

Number of Errors

Displaying Last ETL Run Time

If you have question or comments, leave a comment below.
It is also worth noting that having good naming conventions can really help with navigating the ETL repository. For example all of our interfaces are prefixed with INF_%, and Packages with PKG_%. We also have naming conventions for loading Staging, Dimensions, and Facts, etc.
Below are the steps to bring ODI ETL statistics into OBIEE
Metadata
- Connect to ODI Work Repository to an OBIEE Subject Area and Expose SNP_STEP_REPORT and SNP_EXP_TXT tables to metadata.

Once the physical schema is brought in you will want to rename the columns to something more meaningful. The only column that needs further definition is the decode statement for STEP_STATUS (Status). These can also be found in the ODI Documentation Substitution Methods Reference.
'D' = Success''E' = 'Error''Q' = 'Queued''W' = 'Waiting''M' = 'Warning'

Join SNP_STEP_REPORT and SNP_EXP_TEXT on I_TXT_STEP_MESS = I_TXT. This is the join for the error message text and will display the corresponding error message with the user clicks on the error id.
Dashboard
We created a dashboard for our client with the following elements.
- Last ETL Run date
- Past 5 Days execution time
- Number of Errors
- Past 24 hour execution log

Reports
Past 5 Days Execution Time (in Hours) - High level ETL execution time.
- Sum Duration / 3600 and group by date.

- View every scenario that ran in the past 24 hours.
- Conditional Formatting
- WHEN Status = Success then Green Background
- WHEN Status <> Success then Red Background
- Drill Through
- Interface name to display all executions for this Interface – Drills to All Executions Per Interface
- Error ID to display any error message for this interface - Drills to Interfaces Error Message

All executions per Interface
- This is used so you can see all the executions over its life for a specific scenario, particularly useful to compare with previous runtimes.
- Drills from Past 24 hour log based on scenario name

Interfaces Error Message
- View error message when status is “Error” and background is Red
- Drills from Past 24 hour log based on error message text id

Number of Errors
- Stoplight to display error counts
- SUM(CASE WHEN Status = 'E' THEN 1 ELSE 0 END) Group by Date
- Result Type = Gauge and Gauge Type = Bulb.

Displaying Last ETL Run Time
- MAX( CASE WHEN Status= 'D' Then End_Time) and Scenario Name is equal to / is in [your last ETL step]
- Set a Narrative Text

If you have question or comments, leave a comment below.
Subscribe to:
Posts (Atom)