Here are the steps to integrate Bing maps:
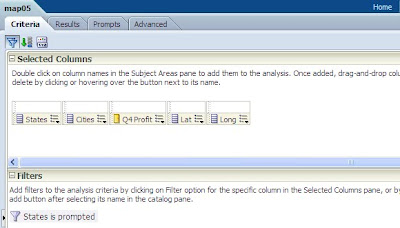
1. Create a new report that includes city, state, latitude, longitude, and the profit amount measure.

2. Format the columns Latitude and Longitude to have at least 6 decimal places to ensure precise plotting on the map.
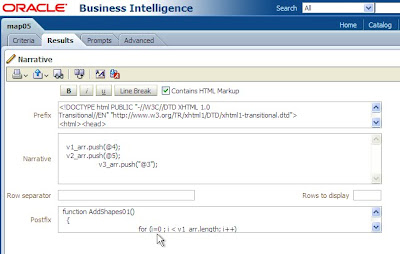
3. Now in the Results tab, add the Narrative view to include the custom Java Script shown below. In the Prefix section call the Bing map API and declare the required variables. In our case we used arrays to hold the latitude, longitude and profit.
var v_lat = [];4. In the Narrative section, pass the required columns with @{column_location} with Latitude and Longitude. In our example we have passed Latitude (@4), Longitude (@5) and Profit (@3).
var v_long = [];
var v_profit = [];
v_lat.push(@4);5. Define the following two functions in the Postfix section:
v_long.push(@5);
v_profit.push("@3"); // The added "$" makes profit a string value.
GetMap(): Sets the default settings for the map (like 2D mode), initial location (init_x1), default view to Road, and map zoom size to 4.
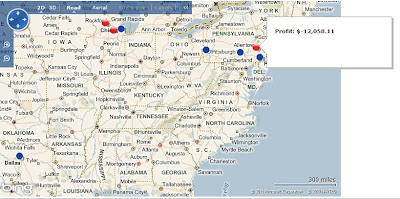
AddShapes01(): Loops through the array length and drops the push pin icons (custom icons) for each latitude and longitude, and their respective title.
6. Check the “Contains HTML Markup” in the Narrative.
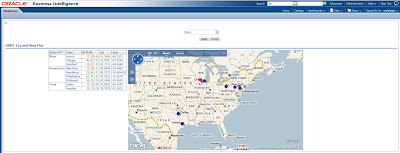
The image below shows the table view and the Narrative View in the dashboard.


The image below shows the table view and the Narrative View in the dashboard.


Feel free to contact us with questions.


No comments:
Post a Comment