It is also worth noting that having good naming conventions can really help with navigating the ETL repository. For example all of our interfaces are prefixed with INF_%, and Packages with PKG_%. We also have naming conventions for loading Staging, Dimensions, and Facts, etc.
Below are the steps to bring ODI ETL statistics into OBIEE
Metadata
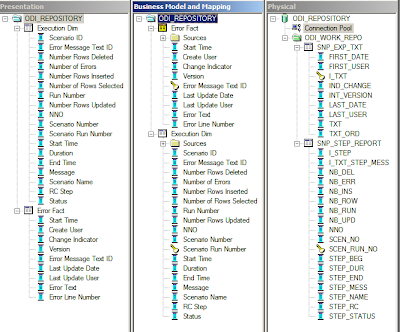
- Connect to ODI Work Repository to an OBIEE Subject Area and Expose SNP_STEP_REPORT and SNP_EXP_TXT tables to metadata.
Once the physical schema is brought in you will want to rename the columns to something more meaningful. The only column that needs further definition is the decode statement for STEP_STATUS (Status). These can also be found in the ODI Documentation Substitution Methods Reference.
'D' = Success''E' = 'Error''Q' = 'Queued''W' = 'Waiting''M' = 'Warning'
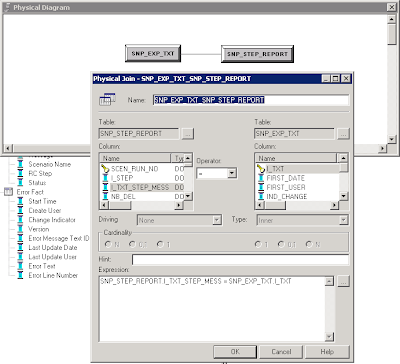
Join SNP_STEP_REPORT and SNP_EXP_TEXT on I_TXT_STEP_MESS = I_TXT. This is the join for the error message text and will display the corresponding error message with the user clicks on the error id.
Dashboard
We created a dashboard for our client with the following elements.
- Last ETL Run date
- Past 5 Days execution time
- Number of Errors
- Past 24 hour execution log
Reports
Past 5 Days Execution Time (in Hours) - High level ETL execution time.
- Sum Duration / 3600 and group by date.
- View every scenario that ran in the past 24 hours.
- Conditional Formatting
- WHEN Status = Success then Green Background
- WHEN Status <> Success then Red Background
- Drill Through
- Interface name to display all executions for this Interface – Drills to All Executions Per Interface
- Error ID to display any error message for this interface - Drills to Interfaces Error Message
All executions per Interface
- This is used so you can see all the executions over its life for a specific scenario, particularly useful to compare with previous runtimes.
- Drills from Past 24 hour log based on scenario name
Interfaces Error Message
- View error message when status is “Error” and background is Red
- Drills from Past 24 hour log based on error message text id
Number of Errors
- Stoplight to display error counts
- SUM(CASE WHEN Status = 'E' THEN 1 ELSE 0 END) Group by Date
- Result Type = Gauge and Gauge Type = Bulb.
Displaying Last ETL Run Time
- MAX( CASE WHEN Status= 'D' Then End_Time) and Scenario Name is equal to / is in [your last ETL step]
- Set a Narrative Text
If you have question or comments, leave a comment below.


